

Canada Markets
A Look at Commercial Canola Inventory

The Canadian Grain Commission reported week 30 commercial canola stocks, covering activity for the week ending Feb. 26, at 1.1778 million metric tons (mmt), the lowest stocks held for this week in nine years, or since 2013-14. This volume is down 17.5% from the same week last crop year, while 25% below the three-year average for this week.
Over 50% of the current inventory remains in country elevator storage in week 30. In total, 53.5% of the total inventory is in primary elevator storage, down from 64.6% reported this time last year and the three-year average of 59.4%.
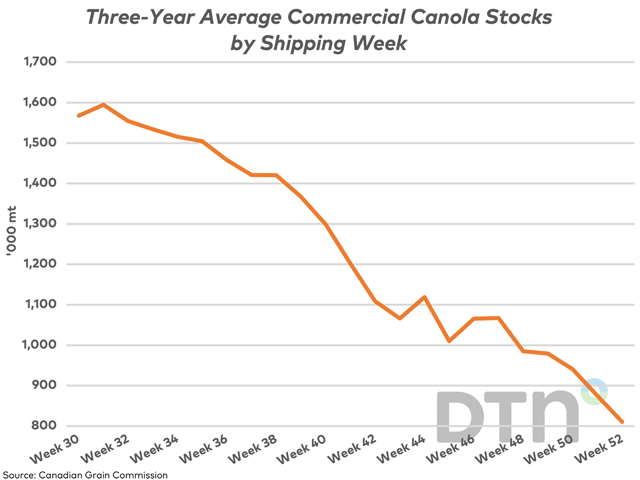
It is difficult to say why stocks are lower as of week 30, given the number of factors involved; this bears watching. As seen on the attached chart, the trend in the three-year average shows a downward trend from week 31 through the balance of the crop year, reaching an average of 810,333 mt by week 52 during the past three years. This is down 49% from the high reached in week 31.
Cliff Jamieson can be reached at cliff.jamieson@dtn.com
Follow him on Twitter @Cliff Jamieson
(c) Copyright 2023 DTN, LLC. All rights reserved.
P[L1] D[0x0] M[300x250] OOP[F] ADUNIT[] T[]
Comments
To comment, please Log In or Join our Community .