

Canada Markets
Alberta Crop Estimates Tend to Get Bigger

Alberta Agriculture's latest Crop Report as of July 26 shows the estimated yield at 114% of the five-year yield index and 110% of the 10-year yield index. Results vary widely across the five regions of the province, ranging from 101% of the five-year index in the North-West Region to 125% in the Peace Region. This estimate was followed by close to a week of extreme temperatures across the province.
Yield estimates by crops range from canola at 40.6 bushels per acre (bpa), or 8.3% higher than the five-year average, to dry peas at 45.5 bpa which is 22.3% higher than average. Spring wheat yield is estimated at 52.3 bpa, or 15.2% higher than average.
P[L1] D[0x0] M[300x250] OOP[F] ADUNIT[] T[]
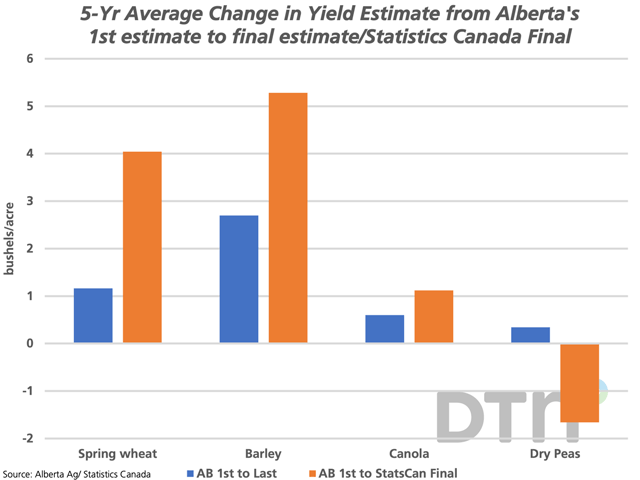
As seen on the attached chart, Alberta Agriculture's estimates, on average over the past five years, have increased from the first estimate in late July/early August to the final estimate of the season, as seen by the blue bars for select crops. The five-year average shows the barley yield increases by 2.7 bpa, spring wheat by 1.2 bpa, canola by .6 bpa and dry peas by .3% from the first to the last estimate of the season.
Estimates for both spring wheat and barley increased from the first estimate to the last estimates in four of the past five years, while the estimates for canola and peas increased in three of the past five years.
The brown bars on the attached chart show the five-year average yield difference from Alberta Agriculture's first yield estimates to the final official estimates from Statistics Canada, which are also expanded to include irrigated acres. The difference is even greater for spring wheat (4 bpa), barley (5.3 bpa) and canola (1.1 bpa), while the average dry pea yield estimate fell by 1.7 bpa.
One crop that bears watching is the province's canola crop, with an estimated 28% of the crop podding compared to the 10-year average of 56%, with the report noting "field specific lack of pod formation," with the crop viewed as "highly variable and inconsistent."
Cliff Jamieson can be reached at cliff.jamieson@dtn.com
Follow Cliff Jamieson on Twitter @Cliff Jamieson
(c) Copyright 2022 DTN, LLC. All rights reserved.
Comments
To comment, please Log In or Join our Community .