Canada Markets
November Canola is at a Crossroads
While European rapeseed for November delivery pushed through support today of its July low to reach its weakest trade in almost five months, canola traders may have showed caution that bears watching.
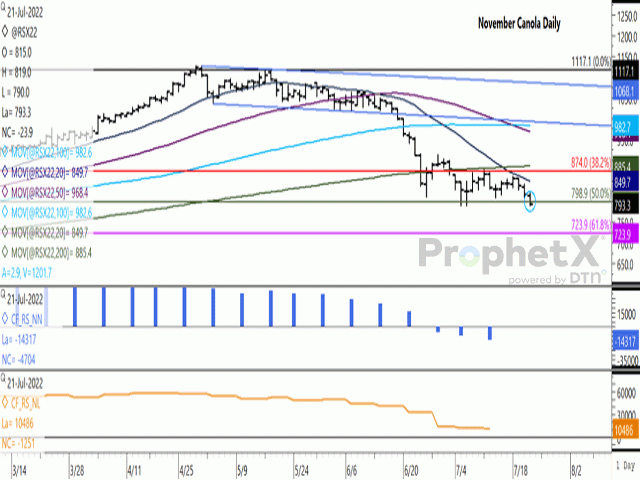
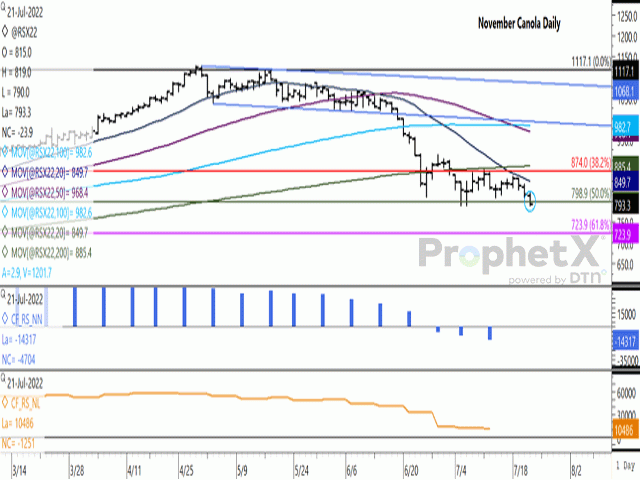
Today's move saw the November contract close lower for a third session, ending $23.90/metric ton lower at $793.30/metric ton, while $62.90/mt lower over three sessions. While not shown, the daily volume was reported at 13,009 contracts for the November contract, close to the highest volume seen in 11 sessions.
P[L1] D[0x0] M[300x250] OOP[F] ADUNIT[] T[]
Thursday's close ended below psychological support of $800/mt for the first time since Jan. 18, or the first time in more than six months. As well, today's close fell below the 50% retracement of the move from the contract low to contract high, calculated at $798.90/mt. We will have to watch for a sustained move below this support, which could lead to a further slide to the 61.8% retracement, calculated at $723.90/mt, as shown by the horizontal purple line.
There are some positives in today's close that bears watching. Today's low fell below the $791/mt low reached on July 5 and the $791.20/mt reached on July 6, a double bottom reached on the daily chart earlier in the month. This could also be viewed as a potential breakout from a sideways range traded for more than three weeks. At the same time, Thursday's trade recovered to hold above the July low.
As seen in the blue bars of the histogram on the first study, the most recent CFTC data shows the noncommercial net-short position increasing for a second week to a bearish 14,317 contracts as of July 12, the largest net-short position seen since July 2020.
The brown line on the lower study shows the move in the noncommercial long position as reported in weekly CFTC data. As of July 12, this number was reported at 10,486 contracts, which is the smallest long or bullish position held by speculators in more than two years, after reaching an all-time high of noncommercial longs at 80,537 contracts as of Jan. 10. Since the CFTC started reporting this data as of August 2018, this long position has never fallen below 3,730 contracts. As stated by DTN Lead Analyst Todd Hultman in recent wheat analysis, "more selling is always possible, but a case could be made that bullish specs have largely been washed out of the wheat market." A similar case can be made for canola.
Cliff Jamieson can be reached at cliff.jamieson@dtn.com
Follow him on Twitter @Cliff Jamieson
(c) Copyright 2022 DTN, LLC. All rights reserved.


Comments
To comment, please Log In or Join our Community .