Canada Markets
November Canola Shows Technical Weakness
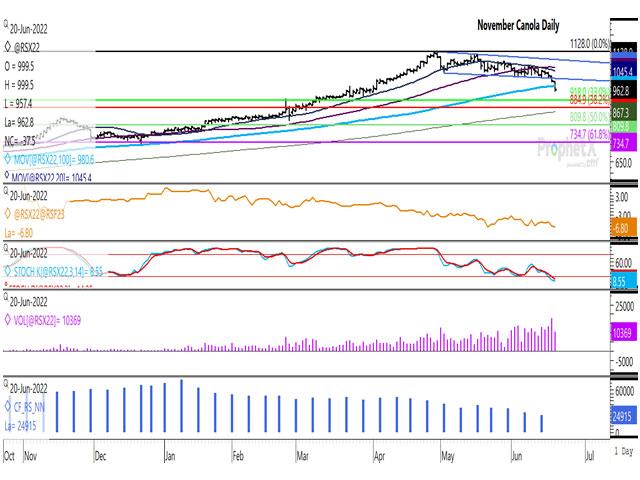
November canola closed lower for a fourth session on June 20, ending $37.50/metric ton lower at $962.80/mt. This is the largest daily loss seen for this contract since May 2, the day after the November contract high of $1,128/mt was reached only to result in a loss for the session of $19.80/mt to close at $1,104.30/mt.
Unlike most sessions when canola trade takes place when U.S. markets are closed, trade volume was high on Monday. A reported 10,369 contracts traded in the November contract, or the most active contract on Monday, which compares to 17,719 contracts traded on Friday and the four-day average of 13,898 contracts. Since Jan. 1, canola traded on its own on Jan. 17, or the U.S. Martin Luther King Jr. Day, when 4,087 contracts traded in the most active March contract, while on May 30, or Memorial Day in the U.S, 2,033 contracts traded in the most active November contract.
P[L1] D[0x0] M[300x250] OOP[F] ADUNIT[] T[]
The brown line on the first study shows the Nov22/Jan23 futures spread weakening by $0.40/mt to minus $6.80/mt, the weakest spread seen during the life of the spread while the weakest spread seen on this date in three years. This time last year, this spread traded at a $0.30/mt inverse (November above the January), while the three-year average is calculated at minus $4.30/mt for this date.
The stochastic momentum indicators in the second study are entering into oversold territory for the first time in more than a year, which may slow technical selling and bears watching.
The blue histogram bars on the lower study shows the noncommercial net-long position falling for a fourth consecutive week in the week ending June 14 to 24,915 contracts, the lowest seen since the week of Sept 7, 2021. This is down 66.4% from the all-time high of 74,055 contracts that was reached in the week ending Jan. 11, 2022. It is interesting to note that one year ago, this position reached a low of 1,349 contracts net-long in the week of June 22, which was the 2021 low reached in advance of the summer drought conditions.
Potential chart support lies at $918/mt, which represents the 33% retracement of the move from the contract low to contract high, while the 38.2% retracement is found at $884.90/mt.
Cliff Jamieson can be reached at cliff.jamieson@dtn.com
Follow him on Twitter @Cliff Jamieson
(c) Copyright 2022 DTN, LLC. All rights reserved.


Comments
To comment, please Log In or Join our Community .