Canada Markets
September Spring Wheat at a Crossroads
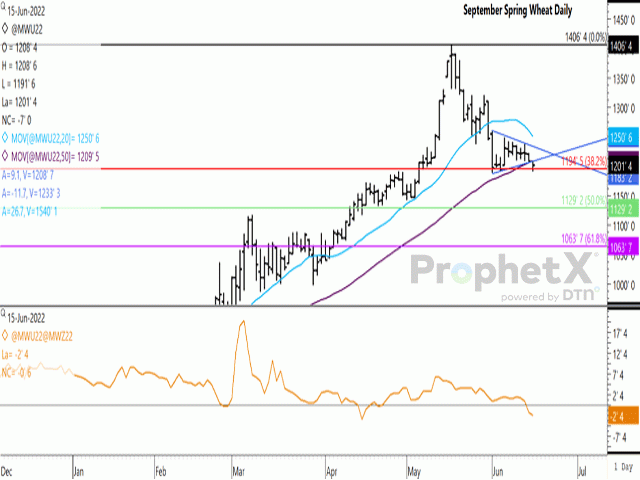
Spring wheat futures closed lower on June 15, with the September contract closing 7 cents lower at $12.01 1/2 per bushel (bu), a second consecutive lower close.
Since June 1, the September MGEX spring wheat contract has traded in a pennant chart pattern, formed by converging trendlines, which saw price breakout lower in June 15 trade with a breach of the lower support line.
P[L1] D[0x0] M[300x250] OOP[F] ADUNIT[] T[]
Today's move breached trendline support seen at $12.09/bu. The move also resulted in a close below the contract's 50-day moving average at $12.09 1/2/bu. This is the first close below the 50-day since Feb. 8.
At the same time, supportive features remain to be tested. The first is the June low of $11.90/bu, with today's low of $11.91 3/4/bu within 1 3/4 cents from testing this low. As well, the four closest contracts, from the July to the March 2023 contracts, all bounced from session lows above $11.90/bu to close above $12/bu on Wednesday.
Finally, support lies at the 38.2% retracement of the move from the Jan. 18 low to the May 17 high, calculated at $11.94 1/2/bu (horizontal red line), with today's low dipping below this support only to bounce higher and close above it. A breach of this move could result in a further slide to the $11.29 1/4 level.
The first study indicates a bearish signal with the September/December futures spread moving from a bullish inverse on June 13 to a modestly bearish carry on June 14, while this spread weakened further on June 15 to minus 2 1/4 cents, the weakest spread seen in two months. On this day in 2021, this spread was reported at minus 1 1/2 cents, while moved to an inverse on the following day. The five-year average for this spread in mid-June is minus 7 cents.
Cliff Jamieson can be reached at cliff.jamieson@dtn.com
Follow him on Twitter @Cliff Jamieson
(c) Copyright 2022 DTN, LLC. All rights reserved.


Comments
To comment, please Log In or Join our Community .