Canada Markets
Mixed Signals in November Canola Bears Watching
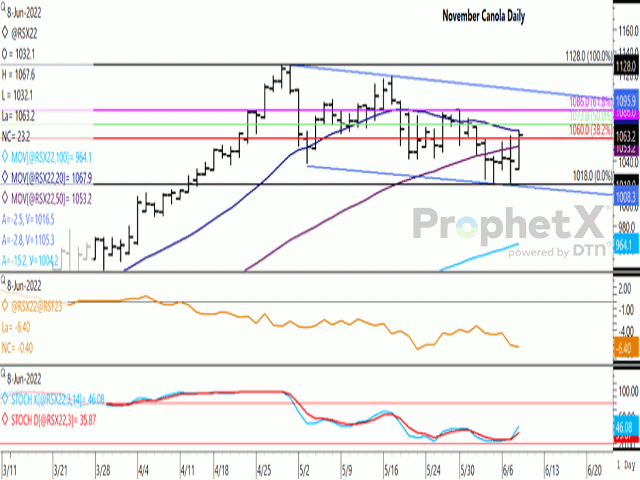
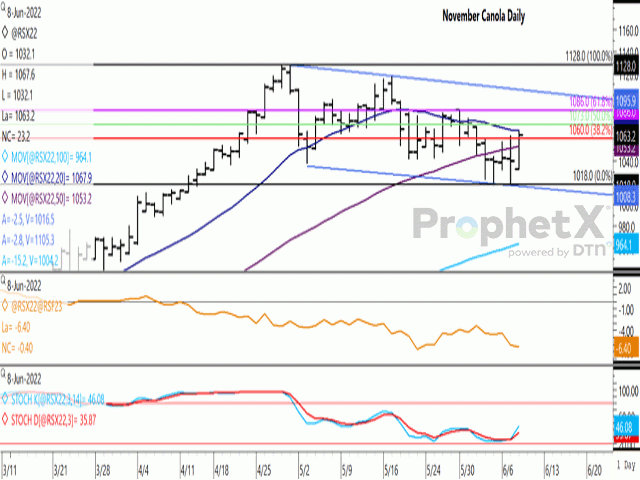
New-crop canola trade led the move higher across all contracts on June 8, with the November contract posting a $23.20/metric ton gain to close at $1,063.20/mt. During the past four consecutive sessions, the daily close fell below the contract's 50-day moving average each day, while closing within a narrow $3.30/mt range during the four days despite trading over a $44.80/mt range during the period. Today's move closed back above the contract's 50-day moving average while tested the contract's 20-day for the first time in six sessions.
Wednesday's move has reached a four-session high, which can be viewed as a bullish technical signal. Wednesday's close also landed above the resistance of the 38.2% resistance of the short-term downtrend from the contract's April high to June low, calculated at $160/mt.
P[L1] D[0x0] M[300x250] OOP[F] ADUNIT[] T[]
Resistance lies at the contract's 20-day moving average at $1,067.90/mt, along with the 50% retracement of the same downtrend, calculated at $1,073/mt. A breakout from the downward sloping channel that has bound trade since the April 29 contract high will require a breach of resistance at $1,105.30/mt.
One trend that bears watching on this chart is the November/January futures spread, as seen by the brown line on the first study. This spread weakened by $0.40/mt on Wednesday to minus $6.40/mt. This is close to the weakest spread seen during the life of the spread, with a low of minus $6.70/mt reached on May 20. Despite tight carryout stocks forecast for this crop year, rainfall lacking in southern and western regions of the Prairies up until this week and ongoing excessive precipitation seen across the eastern Prairies that continues to challenge efforts to seed crops this spring, this particular signal is showing no sign of urgency.
When we compare this new crop spread to the historical spread on this date, we see that this spread was inverted twice on this date during the past 10 years, both in 2021 and in 2015. The five-year average is minus $4.60/mt and the 10-year spread is minus $5.58/mt, which indicates the current spread is weaker than both the five-year and 10-year spread.
Cliff Jamieson can be reached at cliff.jamieson@dtn.com
Follow him on Twitter @Cliff Jamieson
(c) Copyright 2022 DTN, LLC. All rights reserved.


Comments
To comment, please Log In or Join our Community .