Canada Markets
Statistics Canada's March Merchandise Trade
Statistics Canada reported that Canada's merchandise imports and exports reached record highs in the month of March, with energy trade adding substantially to both export and import totals. Canada's trade surplus fell from $3.1 billion in February to $2.5 billion in March for a third straight monthly surplus. Export commentary points to record exports of both energy products and potash during the month.
Exports reported for the broad farm, fishing and intermediate food products fell to $3.664 billion, the lowest monthly dollar value reported in 21 months.
The following analysis focuses on crop export data that is not captured completely in weekly Canadian Grain Commission data.
Lentil exports in March totaled 104,367 metric tons, the largest volume shipped in three months. When measured in dollars, the largest destination during the month was the United Arab Emirates at 36% of the total dollar volume, followed by the United States, at 11% of the total. Cumulative exports at the end of eight months are shown at 969,705 mt, 61.2% of the same period in 2020-21 and 65% of the five-year average. This volume represents 60.6% of the AAFC forecast export volume of 1.6 million metric tons, which was revised 100,000 mt lower in April. Exports remain behind the steady pace needed to reach this forecast.
Dry pea exports were reported at 231,960 mt, the largest monthly volume shipped in 10 months. China was the largest buyer at 188,381 mt or 81% of this volume, the largest volume shipped to this country in six months. Cumulative exports this crop year total 1.335 mmt, representing 49% of the volume shipped over this period in 2020-21 and 56% of the five-year average. This represents 64% of AAFC's 2.1 mmt export forecast, just slightly behind the steady pace needed to reach this forecast.
Exports of chickpeas in March totaled 17,588 mt, the largest volume shipped in eight months. A total of 5,097 mt were shipped to the U.S. with a further 4,923 mt shipped to Syria, the two largest destinations for the month. This is the largest monthly volume shipped to the U.S. in the five years of data provided by Statistics Canada, as well as the largest volume shipped to Syria during this period. So far this crop year, 81,582 mt has been shipped, equal to the volume shipped during the same period last year and 5% below the five-year average. Total exports account for 49.4% of the 165,000 mt forecast released by AAFC, behind the steady pace needed to reach this forecast.
P[L1] D[0x0] M[300x250] OOP[F] ADUNIT[] T[]
Mustard exports reached 10,966 mt in March, the largest volume shipped in three months and the second largest volume shipped this crop year. Exports to the U.S. in March totaled 6,623 mt or 60% of the total, the largest volume shipped to the south since March 2019. Cumulative exports are seen at 71,177 mt, or 96.8% of the volume shipped during the same period last crop year, while represents 92.9% of the five-year average. Exports have reached 89% of the 80,000 mt forecast released by AAFC, well-ahead of the steady pace needed to reach this volume.
Canary seed exports totaled 17,295 mt, the largest volume shipped in three months. A reported 29% of this volume was shipped to Mexico, with a much lower 6.5% shipped to Indonesia and 7.4% shipped to Spain. Cumulative exports total 111,303 mt as of March, up 5.2% from last year and 11.6% higher than the five-year average as buyers front-load purchases due to tight supplies. Exports have reached 89% of the 125,000 mt forecast for the crop year, well-ahead of the steady pace needed to reach this forecast.
Flax seed exports came in at 19,835 mt in March, the largest volume shipped in three months, with 72.6% of this volume destined for the U.S. Exports to China bounced to 2,202 mt, down from 37,326 mt shipped in the same month of 2021. Cumulative exports total 162,154 mt, which represents 41.8% of the volume shipped in the same period last crop year and 52.7% of the five-year average. Total exports to-date account for 54% of the 300,000 mt forecast by AAFC, well-behind the pace needed to reach this volume.
Canada exported 177,741 mt of soybeans in March, up from the previous month. The largest volume was shipped to Indonesia at 32,431 mt and Japan followed at 27,157 mt. Cumulative exports total 3.424 mmt, down 9.3% from the previous crop year and 3.9% below the five-year average. Cumulative exports have reached 85.6% of the 4 mmt forecast for 2021-22 over 58% of the crop year, well-ahead of the steady pace needed to reach this forecast.
Corn exports of 155,107 mt were down from the previous month, while the largest volume shipped in March in 11 years. Of this volume, 137,208 mt was shipped to European countries of Spain, Portugal, Netherlands, United Kingdon and France. Cumulative corn exports total 786,599 mt, up 29.7% from the same week last year and 42% higher than the five-year average. This represents 52.4% of the volume forecast by the USDA, while behind the steady pace needed to reach the current forecast.
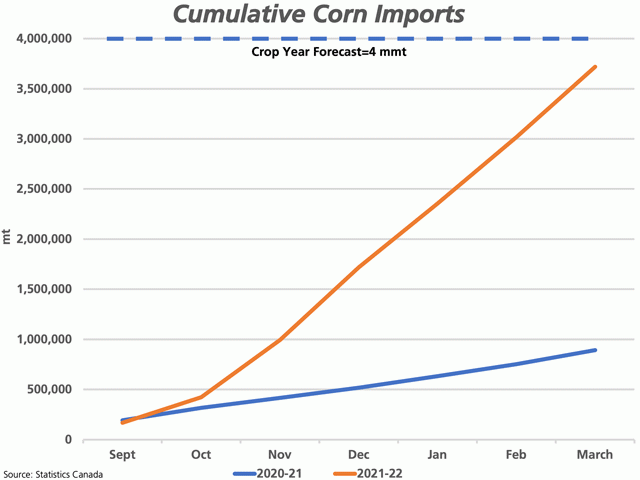
Canada imported 702,343 mt of corn in March, the largest volume imported in three months. Cumulative corn imports of 3.720 mmt are rapidly approaching the 4 mmt forecast released by AAFC for the crop year.
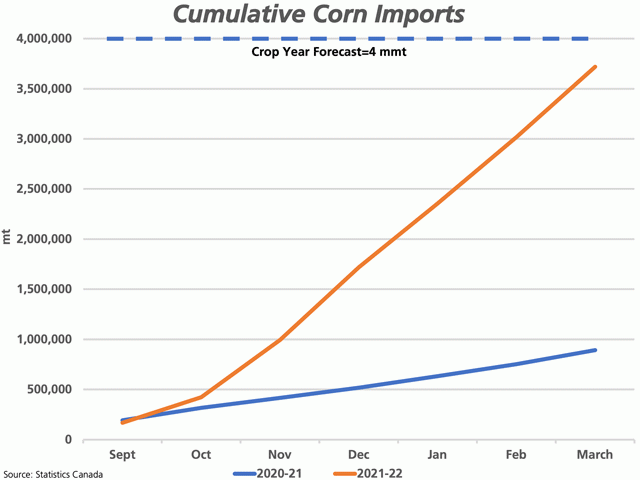
Canada imported 702,343 mt of corn in the month of March, the largest volume imported in three months and the second largest volume imported this crop year. Cumulative imports during the seven months total 3.720 mmt, or 93% of the 4 mmt import forecast released by AAFC in April.
Exports of low erucic acid canola oil totaled 228,731 mt, the largest volume in five months. Cumulative exports total 1.683 mmt, down 25% from the same period in 2020-21 and 23.4% below the three-year average.
Exports of soymeal totaled 425,242 mt in March, the largest volume shipped in three months. Cumulative exports total 3.050 mmt, down 14% from last crop year and 7% below the three-year average.
Ethanol imports totaled 117 million litres in March, up from the previous month and viewed as high when comparing past March data. The first quarter of 2021 shows imports of 353 million litres, up 54% from the same period last year and 35.9% higher than the five-year average. U.S. data for March showed Canada accounting for 27% of U.S. ethanol exports, the largest of all export destinations.
Cliff Jamieson can be reached at cliff.jamieson@dtn.com
Follow him on Twitter @Cliff Jamieson
(c) Copyright 2022 DTN, LLC. All rights reserved.


Comments
To comment, please Log In or Join our Community .