Canada Markets
Canada's February Canola Crush Statistics
Statistics Canada reported 140,695 metric tons of soybeans were crushed in February, the lowest volume processed in five months. This volume is 14,729 mt higher than February 2021, while below the three-year average for the month of 148,843 mt. The volume crushed in February is below the 146,005 mt needed this month to stay on track to reach Agriculture and Agri-Food Canada's forecast of 1.8 million metric tons.
During six months of the soybean crop year (September to August), crush totals 918,660 mt, slightly ahead of the pace needed to reach this forecast. This volume is also slightly higher than the three-year average for this period of 893,048 mt.
P[L1] D[0x0] M[300x250] OOP[F] ADUNIT[] T[]
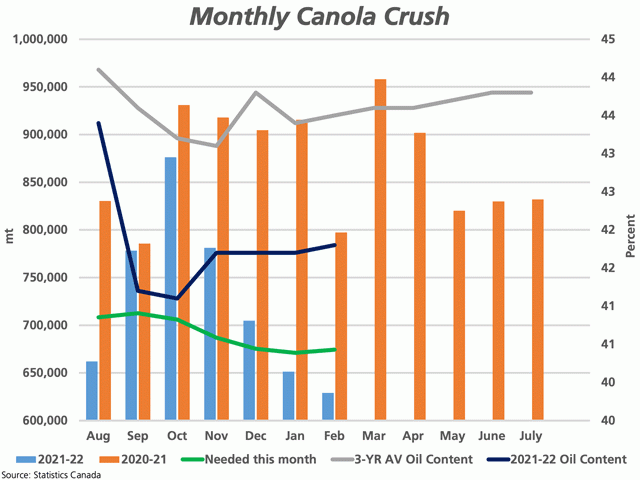
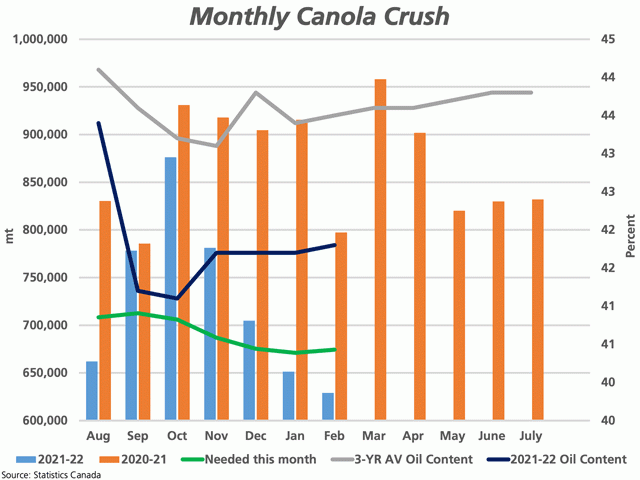
As seen on the attached chart, the canola crush has fallen for four consecutive months to 629,153 mt, the lowest volume crushed this crop year, down from the 797,438 mt crushed in the same month of 2021 and above the three-year average of 748,532 mmt. This volume was below the volume needed this month to stay on track to reach the current 8.5 mmt crush forecast released by AAFC.
During the first seven months of the crop year, 5.083 mmt has been crushed, up 2.5% from the steady pace needed to reach the current forecast, while on track to exceed the 8.5 mmt AAFC forecast.
The black line represents the monthly report of oil content, while at 41.8% is up 0.1 percentage point from the previous month and is the highest reported in six months, or the month of August. While this is down sharply from the 44.1% average for the 2020-21 crop year, it is higher than the 41.3% that the Canadian Grain Commission has recently reported as a prairie average in its final analysis for 2021. Note that the most recent Western Canada canola export quality data points to a mean oil content of 41% for January that will act to pull the average lower.
Cliff Jamieson can be reached at cliff.jamieson@dtn.com
Follow him on Twitter @Cliff Jamieson
(c) Copyright 2022 DTN, LLC. All rights reserved.


Comments
To comment, please Log In or Join our Community .