Canada Markets
Buyers Signal Waning Front-End Interest in Cash Canola
Following markets trading near all-time highs can be stressful. Feb. 10 price action that saw the nearby March ICE canola contract gain as much as $13.60/metric ton to reach a fresh contract high of $1,040.20/mt after weeks of trying, only to meet a wall of noncommercial profit-taking that led to a $6.80/mt lower close for the session with the potential for another lower close on Feb. 11.
A similar move was seen in soybeans, which was ultimately sparked by data from Brazil's Conab that lowered that country's soybean production potential by 15 million metric tons (mmt) to 125.5 mmt, below the 134 mmt estimated by the USDA on the previous day.
At the time of writing, the weekly March canola chart is on the verge of printing a bearish outside reversal bar; a move below the previous week's low of $1,006.70/mt this session and a lower close overall for the week are needed to signal this bearish signal on the weekly chart.
P[L1] D[0x0] M[300x250] OOP[F] ADUNIT[] T[]
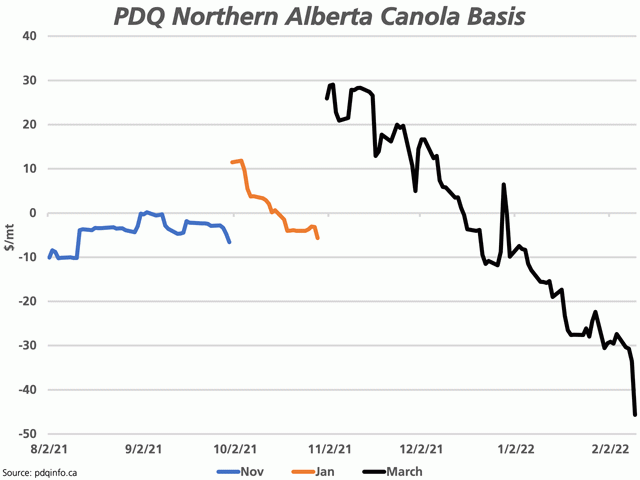
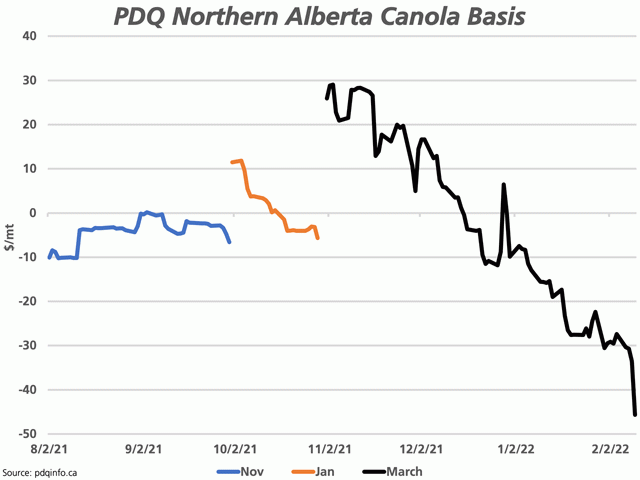
Cash buyers across the Prairies are taking no chances and signal a waning desire to own canola at current levels. Cash basis weakened from $9.74/mt in eastern Manitoba to as much as $13.45/mt in the Peace Region of Alberta on Feb. 10. Weakening futures and basis is a bad combination, while the most weakness was seen in the west, closest to the West Coast ports. As seen on the attached chart, pdqinfo's northern Alberta basis weakened by $12.11/mt to $45.65/mt under the March contract.
As seen by the black line on the attached chart for this region, this basis has moved from as high as $29.02/mt over the future in early November to $45.65/mt under the March on Feb. 10. Note this is a movement in posted prices for one region only. While the trend is similar across all regions, actual prices paid may very greatly depending on need.
For those rolling the dice on even higher prices between now and new crop, April-May delivery across the nine regions reported by pdqinfo ranges from $3.40/mt to $5.73/mt under the May contract, while July delivery across the nine regions is shown from $3.26/mt to $7.17/mt under the July. Based on current trade, these returns are eroded by the March/May inverse of $11.60/mt and the March/July inverse of $42.30/mt.
**
DTN 360 Poll
This week's DTN 360 poll asks your opinions about your approach to secure herbicide supplies for 2022. Please weigh in with your thoughts; you can find the poll on the lower-right side of your DTN Home Page.
Cliff Jamieson can be reached at cliff.jamieson@dtn.com
Follow him on Twitter @Cliff Jamieson
(c) Copyright 2022 DTN, LLC. All rights reserved.


Comments
To comment, please Log In or Join our Community .