Canada Markets
Percent Change in Production Estimates From January Through Final Estimates
Prior to the end of January, Agriculture and Agri-Food Canada's Canada: Outlook for Principal Field Crops report will include the release of the first unofficial estimates for the 2022-23 crop year. The report tends to take a cautious approach, largely based on historical averages, and are updated each month until Statistics Canada releases its first official production estimate, slated for Aug. 29 in 2022.
Production in 2021 could be viewed as an outlier due to extreme drought faced. Across the crops shown on the chart, the estimated production for corn increased 5.1% from the first unofficial estimate in January to the final estimate released in December, the only crop that increased in size during the 11-month period. All other forecasts were revised sharply lower from the first estimate to the final, which ranges from a 5% drop in the soybean forecast to a 57.9% drop in estimated durum production.
P[L1] D[0x0] M[300x250] OOP[F] ADUNIT[] T[]
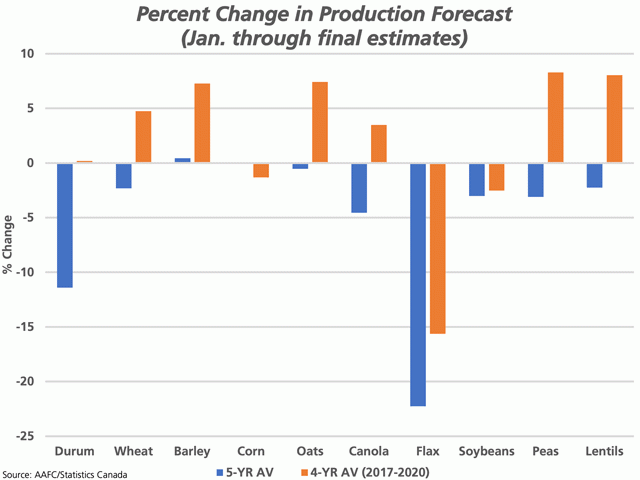
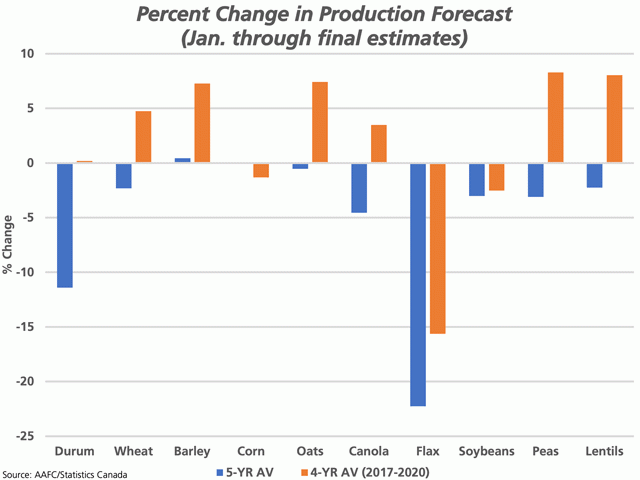
The blue bars on the attached chart represents the five-year average percent change in production from the first unofficial estimate in January to the final released in December, noting that the most recent data is considered which may include revisions. This considers the 2017 to 2021 period, including the disastrous results in 2021. During the past five years, the crops showing the January estimates that are the closest to the final estimates are seen with oats, with the final estimate just 0.5% lower on average, while the January estimate for corn was equal to the final estimate and the average barley estimate was just 0.4% higher. Barley is the only crop where the final estimate was higher than the unofficial estimate in January. During the five-year period, the initial January report tends to overstate production estimates, although this again includes the sharp declines in 2021.
The brown bars are based on a calculation of the four-year average from 2017 to 2020, excluding the 2021 results. Of the crops shown, only three crops show a drop from the January estimate to the final estimate. While still extremely close, the corn production estimate fell only 1.3% on average from January through December, while the soybean estimate fell by 2.5%. The flax estimate fell by 15.6% on average during this four-year period.
Of the seven crops where the four-year average (brown bars) of the January-through-December change in estimated production show an increase, the smallest change is seen for durum, where the four-year average shows a 0.2% increase. It is interesting to note that the final dry pea production estimate averages 8.3% higher than the January estimate during the four years, while the lentil estimate averages 8% higher.
Estimates for barley, flax and soybeans show the most consistency in results when comparing the four-year and five-year averages. Barley production tends to be understated in the January report, with the final production estimate higher on average in both the four-year and five-year period. Production estimates for soybeans and flax tend to be overstated in the January report, with the final production estimates for both crops lower on average over both the four-year and five-year period.
Cliff Jamieson can be reached at cliff.jamieson@dtn.com
Follow him on Twitter @Cliff Jamieson
(c) Copyright 2022 DTN, LLC. All rights reserved.


Comments
To comment, please Log In or Join our Community .