Canada Markets
November Soybeans test Resistance
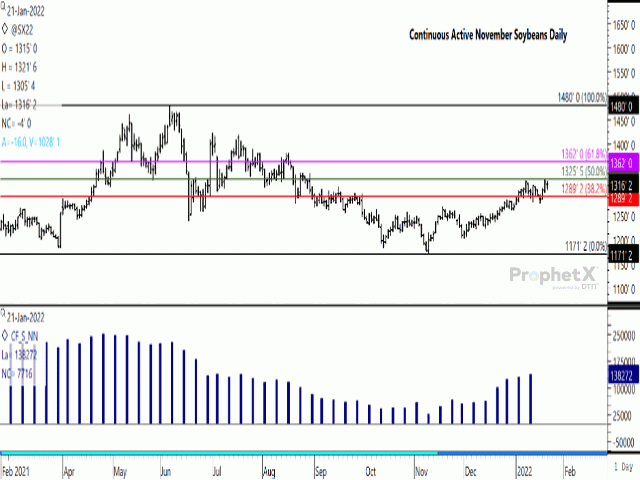
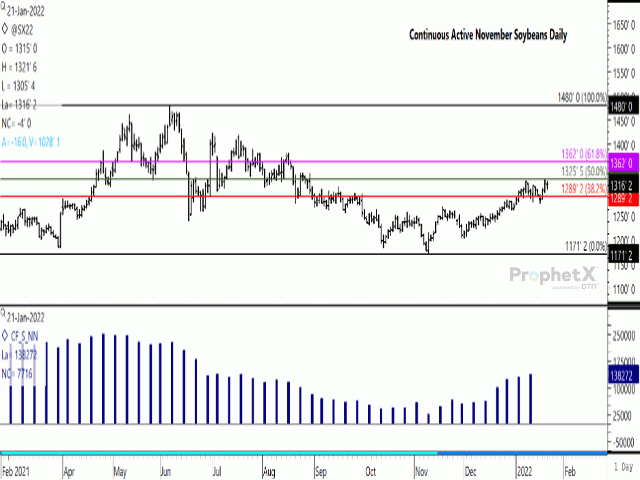
November 2022 soybean futures reached a fresh contract high of $13.25/bushel (bu) on Jan. 20, while closing 15 3/4 cents higher at $13.20 1/4/bu, the second-highest close seen during the life of the contract. Jan. 21 trade saw this contract settle 4 cents lower at $13.16 1/4/bu, while consolidating within the previous session's range in sideways trade. During the week, the January contract gained 23 1/4 cents, printing a bullish outside bar on the weekly chart.
While not shown, the stochastic momentum indicators on the daily chart have yet to reach overbought territory, signaling that further upside may be possible, while prices are seen as overbought on the weekly chart. The Nov 2022/Jan 2023 futures spread closed at a weak carry of 1 cent, which can be viewed as a bullish signal despite indications of increased acres.
The first sign of concern is the potential for a double top formed on the daily chart. This week's contract high reached $13.25/bu, only slightly higher than the $13.22 1/2 high reached on Jan. 7. Sellers have since taken charge forcing Friday's lower close.
P[L1] D[0x0] M[300x250] OOP[F] ADUNIT[] T[]
This week's runup in price is also testing the 50% retracement line of the move from the June 7, 2021, high of $14.80/bu to the Nov. 9, 2021, low of $11.71 1/4/bu, calculated at $13.25 1/2/bu on the continuous November chart. This week's test marks the second test of this resistance this month. A breach of this resistance could lead to a continued move to the 61.8% retracement, calculated at $13.62/bu.
Another test of resistance lies at the neckline of what could be an inverted head-and-shoulders pattern. On the attached continuous November chart, the left shoulder is seen reached on Oct. 13 at $11.84 1/2, the head reached on Nov. 9 at $11.71 1/2 and the right shoulder on Dec. 1 at $12.04 3/4/bu. While not shown, the neckline for this pattern is created by drawing a line from the high following the left shoulder to the high reached following the right shoulder. This neckline has been broken twice this month, while the measuring ability of this pattern points to a potential upside target of $13.92/bu.
**
DTN 360 Poll
This week's poll asks if you think canola's fundamentals will prevail, and if prices will recover from the recent selloff. Please feel free to share your thoughts on this poll, located at the lower right side of your DTN Canada Home Page.
Cliff Jamieson can be reached at cliff.jamieson@dtn.com
Follow him on Twitter @Cliff Jamieson
(c) Copyright 2022 DTN, LLC. All rights reserved.


Comments
To comment, please Log In or Join our Community .