Canada Markets
Prairie Durum Bids Show Volatility
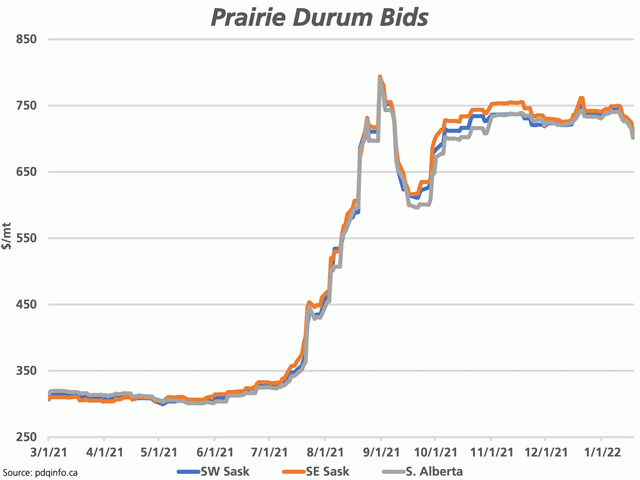
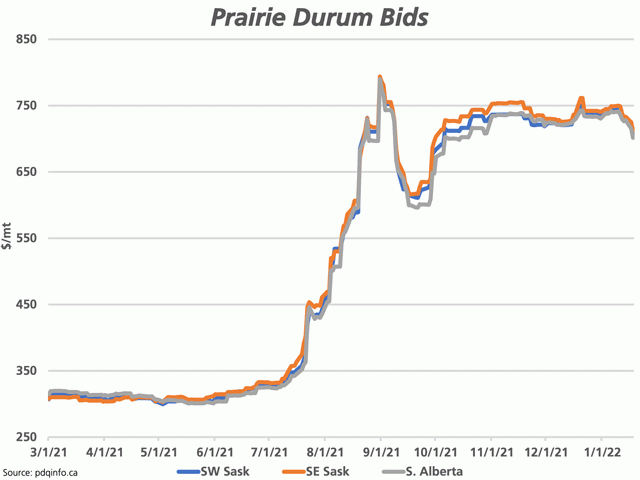
Those watching durum bids on the Prairies have seen a correction since Jan. 10, including sharp losses in the first two days of this week. According to pdqinfo.ca daily bids, the average bid for No. 1 CWAD 13% has fallen $40.14/metric ton in southern Alberta over this period, while the southwest Saskatchewan bid has fallen by $39.24/mt and the southeast Saskatchewan bid by $37.95/mt. While not shown on the attached chart, very modest losses were reported for Jan. 19 across all regions.
The average bids for Jan. 19 are shown at $700.87/mt for southern Alberta ($789.80/mt), $704.47/mt for southwest Saskatchewan ($789.85/mt) and $711.87/mt for southeast Saskatchewan ($793.98/mt), with the crop year high in brackets. The sideways trade since early October led to a recent high (Dec. 20) of $742.76/mt for southern Alberta, $749.39/mt for southwest Saskatchewan and $761.56/mt for southeast Saskatchewan.
Is it time to panic? While no one knows where prices are heading, we have seen emotion rule across the grains in recent trade due to the many uncertainties faced in the market. Here we turn to some durum fundamentals for clues.
A scatter chart that plots historic price against the Canadian durum stocks/use ratio, using 15 years of Agriculture and Agri-Food Canada (AAFC) data from 2006-07 to 2020-21, shows data for 13 of 15 years tightly grouped on the chart, with price ranging from $203/mt to $373/mt and the stocks/use ranging from 12.2% to 18.2%. The most recent AAFC December forecast points to a 15.1% stocks/use ratio for 2021-22, while the trendline on the scatter chart would point to a price under $300/mt based on the 15-year trend, unreliable in the current environment.
P[L1] D[0x0] M[300x250] OOP[F] ADUNIT[] T[]
At the same time, there are some possible reasons for patience.
1) We have seen this before. The southwest Saskatchewan bid, for example, reached an Aug. 31 high of $789.85/mt, fell to a low of $611.04/mt as of Sept. 21 and recovered 77% of this downtrend by late December.
2) Price has not broken below the lows reached since early October, meaning a sideways trend remains in place.
3) Money is flowing back into the grains, including wheat, pushing prices higher. Higher wheat trade should support durum.
4) The U.S. durum market has not corrected lower. DTN's National Durum Index closed at $15.57/bushel USD on Jan. 18, near the upper end of the $0.12/bu USD range traded since Jan. 3.
5) As of week 34, or the week ending Jan. 9, producers have delivered 53.8% of available supplies into licensed facilities (July 31 ending farm stocks plus estimated production), which is above average for this time of year. During the past three crop years, an average of 34.4% has been delivered during the same period, as high as 42.1% in 2020-21 and as low as 24.5% in 2018-19. Despite the smaller crop, close to 50% remains on farm and buyers may have to increase bids to see it delivered.
6) During the past five crop years, an average of 36.7% of total crop year exports were shipped from the licensed handling system in the first 23 weeks of the crop year. Exports tend to be weighted more heavily in the last half of the crop year, although this crop year may be an exception due to Canada's limited supplies and an early move to secure them by importers.
7) Reports are indicating that Italy is a likely candidate to step into the market. Canada's durum exports to Italy have increased in each of the past three years, reported at 1.490 million metric tons in 2020-21. During the past three crop years, an average of 46.6% of total crop year exports to Italy were seen in the first half of the crop year, or by the end of January, while demand is seen more heavily weighted to the last six months, or February through July. As of November, or the first one-third of the crop year, shipments to Italy are reported at 229,600 mt, or the slowest pace of movement in four years.
Cliff Jamieson can be reached at cliff.jamieson@dtn.com
Follow him on Twitter @Cliff Jamieson
(c) Copyright 2022 DTN, LLC. All rights reserved.


Comments
To comment, please Log In or Join our Community .