Canada Markets
A Look at the Long-Term Spring Wheat Chart
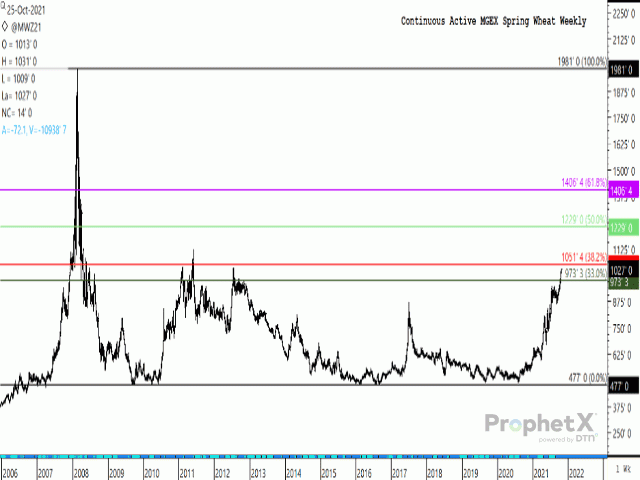
December hard red spring wheat closed 14 cents higher on Oct. 25 at $10.27/bushel (bu), after reaching a $10.31 high, down only 4 cents from the $10.35 reached on July 23, 2012, on the September contract.
Since reaching a fresh contract high on Oct. 6, the December contract has closed higher in nine of 13 sessions, a move that has included a push through the psychological $10/bu level on Oct. 22 and a further push higher in the following session.
P[L1] D[0x0] M[300x250] OOP[F] ADUNIT[] T[]
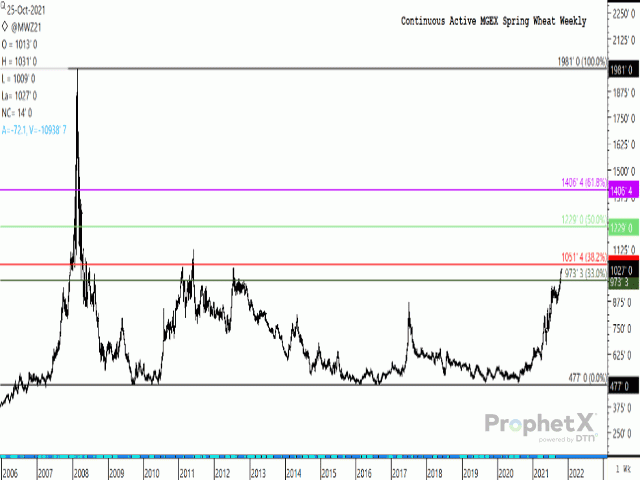
Potential resistance lies at the 2012 high of $10.35/bu, as well as at $10.51 1/2/bu, the 38.2% retracement of the move from the February 2008 high to the $4.77/bu low reached in Oct. 2009. A breach of this level could result in a continued move to the contract's 50% retracement level at $12.29/bu.
The attached chart shows a "W" pattern or double bottom that started the week of Aug. 16, 2012 and carries on through today's close. The first move towards the $4.77 support reached in 2009 saw a dip to $480.25/bu, reached the week of August 2016. A high of $8.68 1/2/bu was reached during the week of July 5, 2017, only to dip to support once again in the week of Sept. 3, 2019, of $4.86 1/2/bu.
This pattern broke the July 2017 resistance level in July 2021 trade, while technical analysis theory would result in a target set at $12.57/bu, which is equal to the distance from the August 2016 low to the July 2017 high, while added to the July 2017 high, or:
($8.68 1/2 minus $4.80 1/4) plus $8.68 1/2 = $12.57/bu.
Cliff Jamieson can be reached at cliff.jamieson@dtn.com
Follow him on Twitter @Cliff Jamieson
(c) Copyright 2021 DTN, LLC. All rights reserved.


Comments
To comment, please Log In or Join our Community .