Canada Markets
Canadian Dollar Quickly Paring 2021 Gains
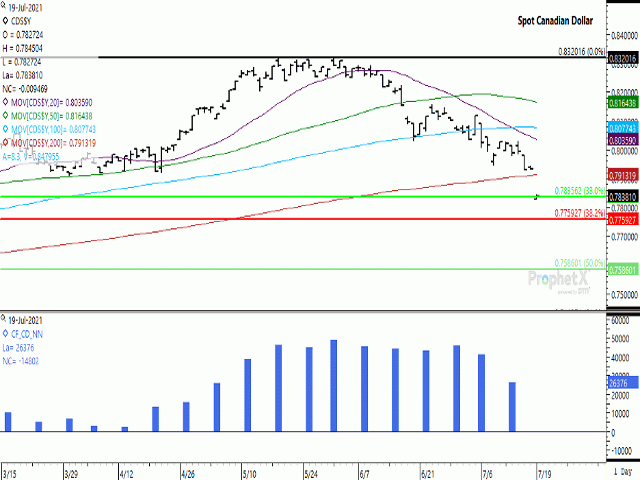
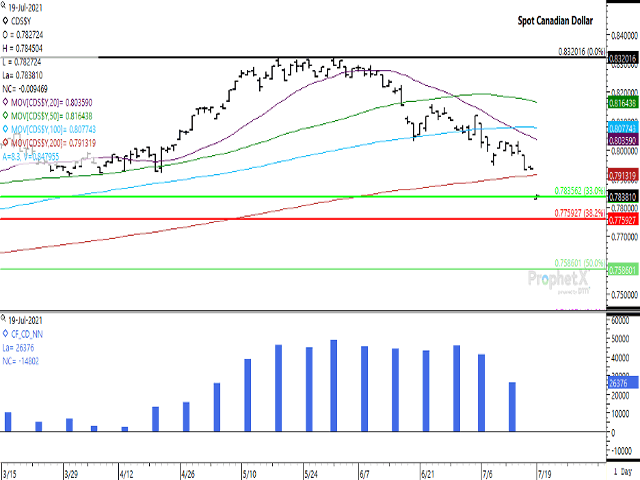
After reaching a low of $0.685185 CAD/USD on March 18, 2020, the lowest trade seen since January 2016, the Canadian dollar appreciated 21.4% against the United States dollar to a high of $0.832016 CAD/USD on June 1, 2021. The exchange rate struggled with resistance near this high for the last half of May and prior to turning lower.
Since reaching the high in early June, the Canadian dollar has realized five weekly losses of the six weeks traded, with the 96-basis-point drop seen for the week of July 12 the second largest of the five weekly losses. The moves have seen the exchange rate breach support from the 20-day, 50-day and 100-day moving averages over this period.
The July 19 close for the spot dollar saw a further drop of 95 basis points to $0.783810 CAD/USD, breaching the 200-day moving average for the spot dollar, while forming a bearish gap lower on the chart. This move saw the spot dollar reach its lowest trade since Feb. 8, while dipping below the 33% retracement of the move from the contract's March 2020 low to June 2021 high, calculated at $0.783562 CAD/USD and shown by the horizontal green line.
P[L1] D[0x0] M[300x250] OOP[F] ADUNIT[] T[]
A sustained closed below this line could result in a continued move to the 38.2% retracement at $0.775927 CAD/USD (horizontal red line), which would represent the lowest level traded in 2021.
A further bearish signal is seen in the direction of the spot dollar's 20-day moving average, which has moved below the 50-day and 100-day moving average in recent trade, while pointing towards a potential breach of the 200-day moving average.
The lower study shows the noncommercial net-long futures position reaching a high of 48,772 contracts as of June 1, the same day of the most recent high, while this bullish position has been under pressure since. As seen on the attached chart, this position has been reduced in five of the past six weeks, while the 36% drop in the week ending July 13 was the largest week-over-week drop seen over this period and to the smallest bullish position seen in 10 weeks.
Several market factors are combining to weigh on Canada's currency. During the weekend it was announced that OPEC has reached a deal that would see an additional 400,000 barrels/day pumped in August and up to 2 million bpd by the end of December. This weighed heavily on crude oil. The Bank of Canada revised its forecast for Canada's growth by 0.5 percentage points lower to 6% last week. In addition, reported tensions between China and the U.S. are leading to the USD viewed as a safe haven, while the resource currencies such as the Canadian dollar are being sold.
Cliff Jamieson can be reached at cliff.jamieson@dtn.com
Follow him on Twitter @Cliff Jamieson
(c) Copyright 2021 DTN, LLC. All rights reserved.


Comments
To comment, please Log In or Join our Community .