Canada Markets
HRS/HRW Spread Continues to Strengthen
Declining North American spring wheat conditions along with slightly lower than average hard red winter proteins have led to a widening spread between the two classes. Early in the week, USDA estimated the U.S. spring wheat crop at 16 % good to excellent, with North Dakota's crop, representing approximately 50% of U.S. production, rated at 16% good to excellent and equal to the six-state average. As of July 12, Saskatchewan Agriculture rated the province's crop at 25% good to excellent, down from 58% reported on June 28. As of July 13, Alberta's spring wheat crop was rated at 38.8% good to excellent, down from 70.8% two weeks earlier. Manitoba's Crop Report also points to deteriorating crop conditions.
This week's U.S. Wheat Associates Weekly Harvest Report shows the average HRW protein content at 11.4% as of July 16, with 266 out of an estimated 500 samples tested. This is up from 11% reported the previous week, but down from the 11.9% final average in 2020 and the five-year average of 11.6%.
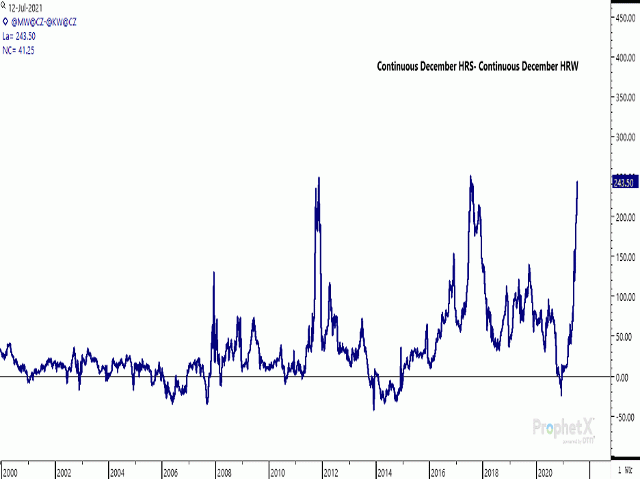
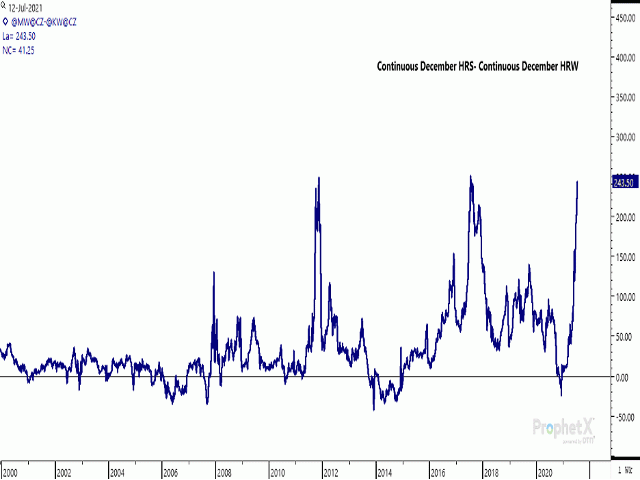
As a result, the December spring wheat/December hard red winter wheat futures spread, a proxy for the demand for higher protein wheat, closed at $2.43 1/2 bushel (bu) USD on July 16. As seen on the attached chart, this spread has strengthened from a low of minus 23 3/4 cents USD as of the week of Dec. 7, 2020 (HRW trading over spring wheat), which was the weakest weekly spread seen since October 2014.
P[L1] D[0x0] M[300x250] OOP[F] ADUNIT[] T[]
This week's close of $2.43 1/2 bu is the highest seen since the weekly high of $2.50 3/4 bu was reported in July 2017, while $2.48 3/4 was reached in October 2011. These are the two widest spreads reached in ProphetX data going back to 1980 and reflect a double-top on the attached chart.
The cash market spread in the U.S., based on DTN's National Spring Wheat Index and National Hard Red Winter Wheat Index, closed at $2.50/bu on Thursday. This spread reached $2.95/bu in July 2017 and $2.89/bu in June 2011. The cash market spread saw the National Spring Wheat Index reach a $7.97/bu premium over the National Hard Red Winter Index in February 2008, although this move lasted only briefly.
North American crops are not the only spring crops in the news. This week's USDA estimates lowered Kazakhstan's crop by 1 million metric tons (mmt) to 13 mmt, a volume that is down 8.8% from last year and 6.4% below the five-year average. The USDA also scaled back their forecast for Russia's total wheat production, revising it lower by 1 mmt to 85 mmt due to concerns over Russia's spring wheat potential, while other global analysts are releasing estimates several million metric tons lower than USDA. This compares to Russia's 2020 production of 85.354 mmt and five-year average production of 77.669 mmt.
**
DTN 360 Poll
This week's poll question asks which crop you think has the greatest upside price potential over the upcoming crop year. Please feel free to weigh in with your thoughts, with this poll found on the lower-right side of your DTN Home Page.
Cliff Jamieson can be reached at cliff.jamieson@dtn.com
Follow him on Twitter @Cliff Jamieson
(c) Copyright 2021 DTN, LLC. All rights reserved.


Comments
To comment, please Log In or Join our Community .