Canada Markets
Canola Shows Resilience Despite Sharp Losses
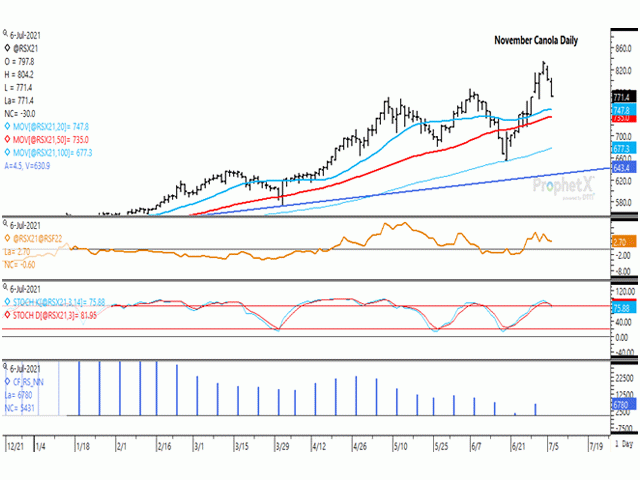
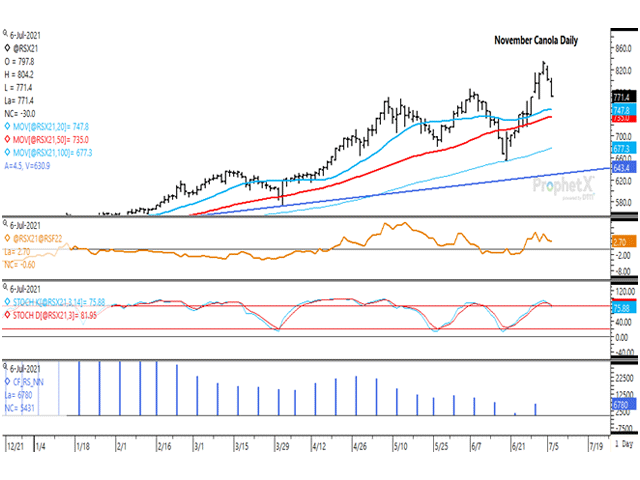
The November ICE canola contract reached an all-time high for November contract trade on July 2 of $835.60/metric ton, only to fall by $29.50/mt on July 5 and a further $30/mt on July 6, with every single contract from the November to the July 2022 contract ending down by $30/mt this session. Despite the losses, trade continues to evolve well-within last week's range in sideways trade although last week's range was $98.50/mt, the widest trading range seen over the life of the contract.
Despite the loss faced this week, canola has shown some resilience compared to the soy complex. While the July 6 close for November canola is down 7.7% from its July 2 high, November soybeans are down 8.3% and soybean oil for October delivery is down 9.3%. Soybean oil moved below its 20- and 50-day moving averages this session, while November soybeans moved and closed below its 20-day, 50-day and 100-day moving average. October soymeal closed below its 200-day moving average for the seventh time in 10 sessions. Canola has held above all major moving averages for nine consecutive sessions.
The brown line on the first study represents the Nov/Jan futures spread. This spread closed unchanged on July 6 at a $3.30/mt inverse (November above the January), continuing to signal a tight front-end situation.
P[L1] D[0x0] M[300x250] OOP[F] ADUNIT[] T[]
The blue bars of the lower study shows the noncommercial net-long position as of June 29. As of June 22, this bullish position had fallen for seven of the eight weeks since the week of April 27 to just 1,349 contracts net-long as of June 22. This was the smallest net-long position seen since this group of traders moved into a bullish net-long position in August 2020. This position rebounded to 6,780 contracts net-long as of June 29, but this group is once again liquidating.
**
DTN 360 Poll
This week's poll asks how you would best describe the condition of the crop in your area? You can weigh in with this chart, found on the lower-right of your DTN Home Page.
Cliff Jamieson can be reached at cliff.jamieson@dtn.com
Follow him on Twitter @Cliff Jamieson
(c) Copyright 2021 DTN, LLC. All rights reserved.


Comments
To comment, please Log In or Join our Community .