Canada Markets
Palm Oil's Bearish Technical Signals
The USDA's June Oilseeds: World Markets and Trade report saw minor tweaks to global vegetable oil estimates. Global oilseed production of the nine major vegetable oils (coconut, cottonseed, olive, palm, palm kernel, peanut, rapeseed, soybean, sunflowerseed) was revised slightly higher from the May estimate to 216.17 million metric tons, up 4% from 2020-21 and a sixth consecutive record global production estimate. The upward change since the May report was due entirely to an increase in rapeseed/canola oil production.
Global consumption was tweaked lower this month to 213.01 mmt, up 2.8% from 2020-21 estimates and a record high, the spread between estimated production and consumption (production-consumption) is forecast at 3.161 mmt for 2021-22, up from 0.541 mmt in the previous crop year while below the five-year average of 4.066 mmt and the 10-year average of 3.985 mmt.
Global ending stocks were revised slightly lower this month, while at 22.32 mmt, are down 1.9% from 2020-21 and the lowest stocks seen since 2010-11. Stocks as a percent of use, or the stocks/use ratio, is calculated at 10.5% for 2021-22, down from 11% for the current crop year, while the tightest seen since 1997-98.
P[L1] D[0x0] M[300x250] OOP[F] ADUNIT[] T[]
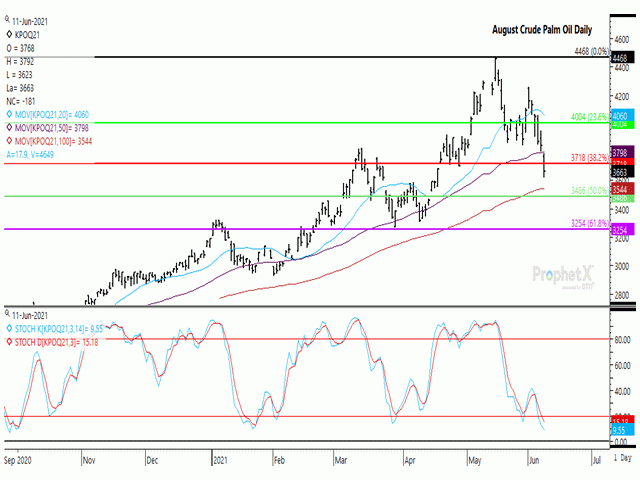
Palm oil is one of the markets facing a correction. The Malaysian crude palm oil contract for August delivery has fallen 18% from its May 18 high as of the June 11 close. This compares to the 9.2% drop seen in soybean oil since reaching its recent June 7 all-time high.
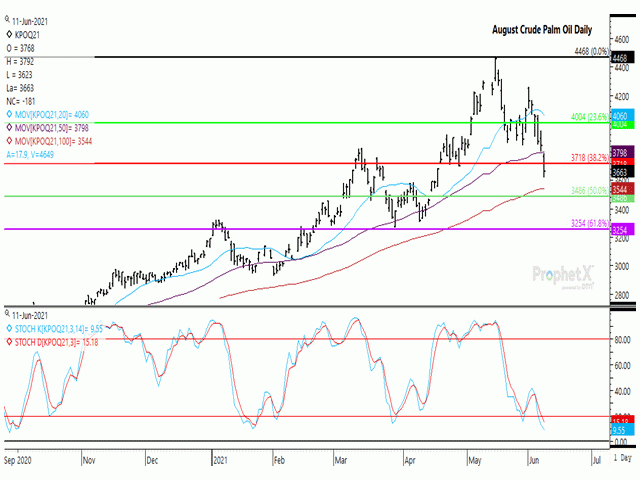
As seen on the attached chart, the benchmark August Malaysian crude oil contract fell for a fifth straight session on June 11, closing 4.7% lower for the session and by the largest percentage loss seen during these five days. During the week, this contract has fallen by 11.3%, reaching its lowest level seen in seven weeks.
There have been several breaches of support that has led to further technical selling over the week. The June 8 trade resulted in a close below the contract's 20-day moving average, while for the sixth time in 10 sessions. The June 11 trade saw a bearish gap lower formed on the chart, with the June 11 high below the June 10 low. The June 11 close ended below the contract's 50-day moving average (purple line) and closed below the 38.2% retracement of the move from the contract's low to the contract high, calculated at 3718 ringgits in local currency terms. In addition, today's move breached the support of the gap in traded formed in the April 21-to-April 22 sessions.
Given this week's move, potential support lies at the contract's 100-day moving average, which indicates a further 3.2% drop from this week's close, or the 50% retracement line, which is 4.8% below this week's close.
It is interesting to note that the stochastic momentum indicators on the daily chart have moved into oversold territory, which may slow technical selling, although the weekly chart (not shown) shows these indicators trending lower and near the middle of the neutral zone on the chart, which indicates further downside is possible.
Cliff Jamieson can be reached at cliff.jamieson@dtn.com
Follow him on Twitter @Cliff Jamieson
(c) Copyright 2021 DTN, LLC. All rights reserved.


Comments
To comment, please Log In or Join our Community .