Canada Markets
Grain Handling Statistics Show Movement Slowing
Canada's two major railways spotted 99% of the cars wanted for loading in week 42, their best weekly performance achieved so far this crop year, although the demand for shipping is sharply reduced, making it easier for the railways to meet this demand.
As reported by the AG Transport Coalition's Weekly Performance Update, CN Rail spotted 98% of the cars wanted for loading during week 42, the company's best performance this crop year. At the same time, CP Rail spotted 99% of the cars wanted, down from the 100% spotted in the week prior.
P[L1] D[0x0] M[300x250] OOP[F] ADUNIT[] T[]
While performance is seen improving using this metric, the demand for shipping is seen falling off fast. The Weekly Performance Update shows demand for shipping falling to 6,250 hopper cars for the week, the lowest weekly demand reported for the crop year, down 35.4% from the same week in 2019-20 and down 19.6% from the three-year average. The previous four-week average is 8,577 cars.
This slower movement is due to slowing demand as opposed to tight supplies. Despite the pace of exports this crop year, the Canadian Grain Commission reports primary elevator stocks as of week 42, or the week ending May 23, at 2.8754 million metric tons, up 12.8% from the same week in 2019-20, up 18.6% from the three-year average and 21.7% higher than the five-year average.
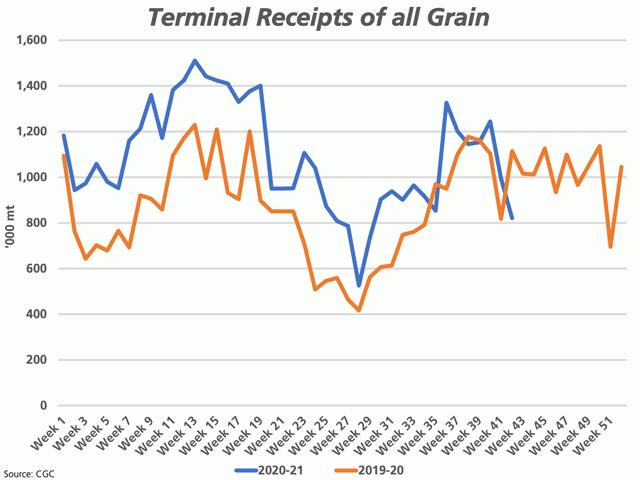
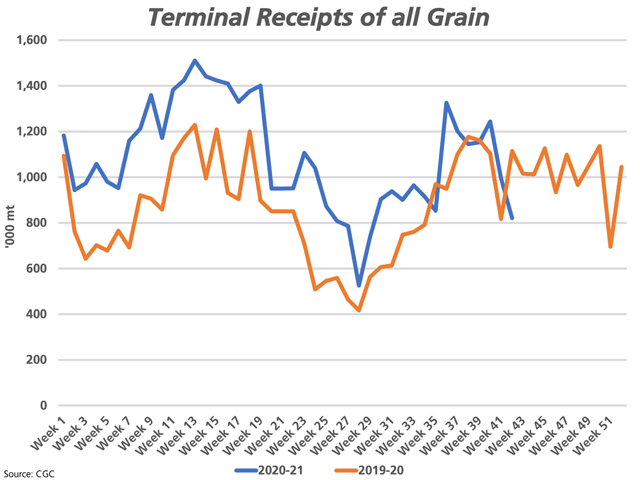
As seen on the attached chart, the CGC reports week 42 unloads at licensed terminals at 820,900 metric tons, the lowest weekly volume unloaded in 13 weeks. This is down 26.3% from the same week last crop year and 12.2% below the three-year average for this week. Weekly unloads fell below this volume in only four weeks this crop year, or from week 26 through week 29. Bitter cold weather in February slowed movement, with the smallest volume unloaded reported at 525,300 mt in week 28.
Daily statistics from the AG Transport Coalition points to further slowing, with the daily average number of loads on wheels as of May 27, or in week 43, shows the daily average of loads on wheels at 6,794 cars, down 7% or from 7,306 from the previous week. As of this day, the daily average number of cars unloaded at the western ports is reported at 1,084 cars, down 8% from the previous week, while the 774 cars unloaded at Vancouver is down 13% from the previous week.
Cliff Jamieson can be reached at cliff.jamieson@dtn.com
Follow him on Twitter @Cliff Jamieson
(c) Copyright 2021 DTN, LLC. All rights reserved.


Comments
To comment, please Log In or Join our Community .