

Canada Markets
November Canola Turns Higher
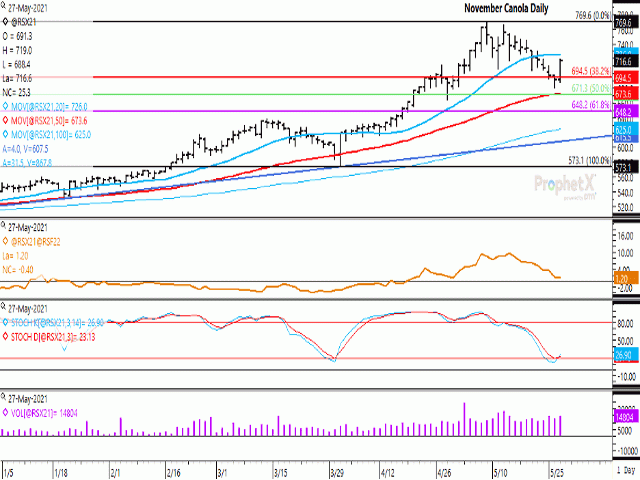
The November canola contract closed higher for the first time in eight sessions on Thursday, ending $25.30 metric ton (mt) higher at $716.60/mt. Spillover buying was seen due to gains realized for soybeans and soybean products and European rapeseed, along with concerns surrounding this week's frost event and canola's tight fundamental situation.
While not shown, the forward curve for canola, or a line that connects the daily close for consecutive contracts, is downward sloping from the nearby July contract through to March 2023. Each contract trades higher than the one that follows, signaling an ongoing bullish view of fundamentals that acts to encourage front-end deliveries and discourage storage.
P[L1] D[0x0] M[300x250] OOP[F] ADUNIT[] T[]
As seen on the attached chart, the November contract closed below the horizontal red line on May 26, which represents the 38.2% retracement of the move from the March 31 low to the May 7 high, calculated at $694.50/mt. Thursday's trade bounced back to end above this support, posting its largest one-day move since a limit-up move of $30/mt on March 31.
The brown line on the first study shows the Nov/Jan futures spread weakened by a modest amount of $0.40/mt on Thursday to close at a $1.20/mt inverse (Nov closing over Jan). This is the weakest inverse seen since April 29, although continues to reflect a bullish view of new-crop fundamentals. Over the past five years, this spread has averaged a $4.92/mt carry on this date (Jan over the Nov), while trading at a carry on this date on each of the past five years.
Grains in general have recently been oversold, contributing to the sudden change in direction realized in Thursday's session. The middle study shows the stochastic momentum indicators crossing and turning higher while near oversold territory. It should be noted the most bullish of crosses are seen when these indicators cross over while in oversold territory, or below the horizontal red line of 20 on the chart. This is not the situation seen on the current chart.
The lower study signals Thursday's daily volume of 14,804 contracts in the November contract was the highest volume reported in 10 sessions. This indicates conviction on the part of buyers this session.
Cliff Jamieson can be reached at cliff.jamieson@dtn.com
Follow him on Twitter @Cliff Jamieson
(c) Copyright 2021 DTN, LLC. All rights reserved.

Comments
To comment, please Log In or Join our Community .