Canada Markets
A Look at Historical November Canola Highs
Since this week's bullish Statistics Canada report, which estimated that Canadian producers will seed 21.5 million acres of canola in 2021, up a modest 3.6% while at the lower-end of pre-report estimates, new-crop November canola fell on the day of the report and in the day following the report. As of April 29, the November contract is down $2.60/mt during the course of this week's trade, while potentially poised for its first weekly loss in five weeks.
The Nov/Jan futures spread has also weakened by $1.90/mt during the first four days of the week, while ending April 29 trade with a modest $1.20/mt inverse, which is the weakest inverse seen in seven days.
On April 27, the November contract reached a high of $711.50/mt, the first move above $700 achieved by this contract while the highest move seen on the continuous November chart since the November 2008 contract reached a high of $772.10/mt in December 2007.
P[L1] D[0x0] M[300x250] OOP[F] ADUNIT[] T[]
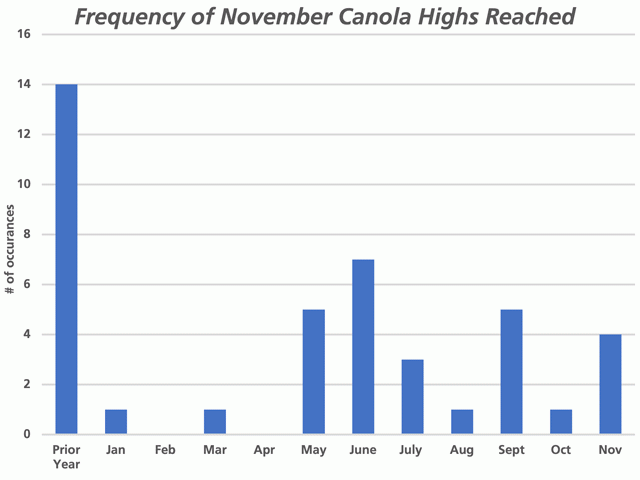
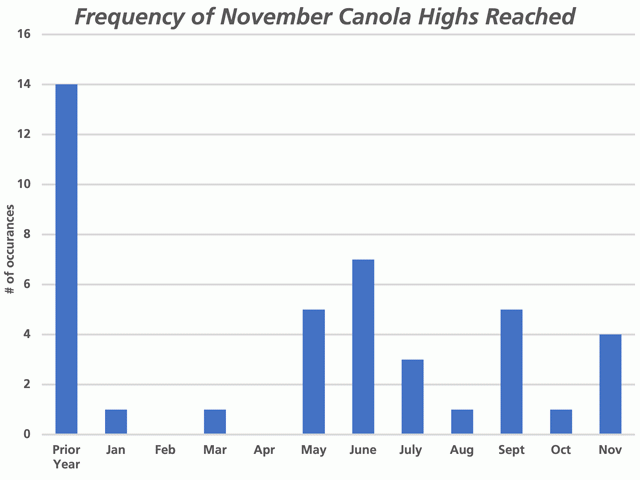
Following this week's failure for the market to trade higher despite a bullish data release, what are the chances that the November contract has seen its highs? The attached chart looks at historical highs for the November contract during the 40 years from 1981 to 2020, with a focus on the month that the high was reached.
What jumps out is that during the past 40 years, the November contract has only reached a high in the first four months of the year on two occasions, once in January and once in March. During this period, the November contract has never reached its contract high in the months of February or April.
The summer months are the most likely to see the high reached, with five occurrences in May, seven in June and three in July. Highs are most commonly reached after the crop has been seeded, when there is a better feel for seeded acres' spring moisture along with the potential for summer heat is better understood.
Data for the August through November period could be viewed as over-stated in this study, with the November 1994 contract reaching a $399.50/mt high in June, while reaching this high again in September and once again in November, while this high was counted for each of the three months.
Over the past five years (2016-2020), the November contract has reached its high prior to the contract's calendar year in one year, in the month of June in two of the five years, in July for one of the five years and in November in one of the five years. Once again, three of five -- or 60% -- of these highs were reached in the summer.
Cliff Jamieson can be reached at cliff.jamieson@dtn.com
Follow him on Twitter @Cliff Jamieson
(c) Copyright 2021 DTN, LLC. All rights reserved.


Comments
To comment, please Log In or Join our Community .