Canada Markets
Week 32 Rail Performance
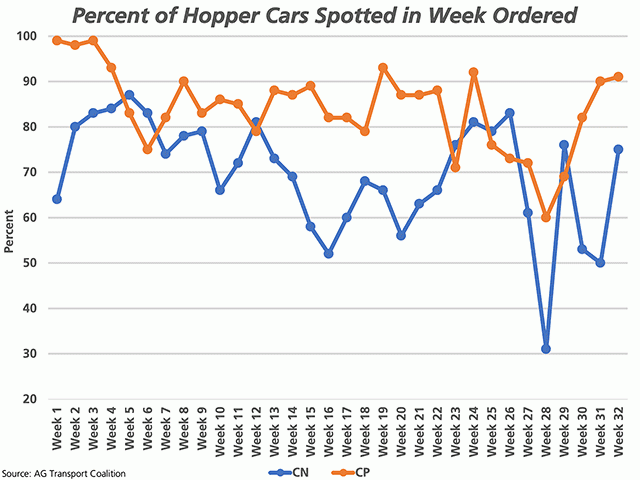
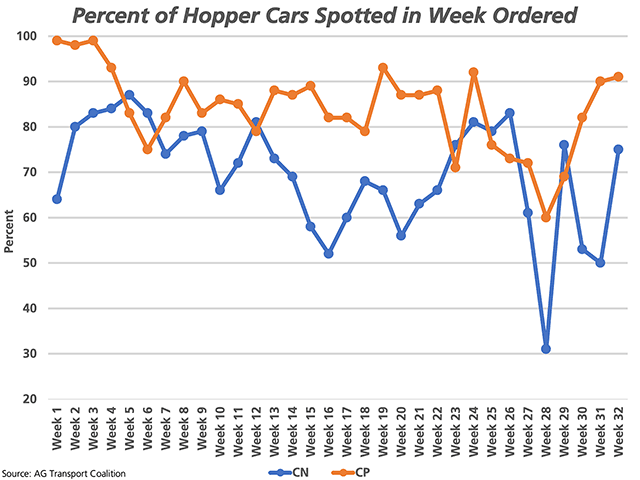
Weekly AG Transport Coalition data for week 32 shows the Canadian Pacific Railroad (brown line) spotting 91% of the cars wanted for loading during the week wanted, up slightly from the 90% reported the week prior. The coalition, which ships 90% of the western Canadian grain, describes the 90% of cars ordered that are spotted during the week wanted as a threshold. CP has reached the 90% or better threshold for the ninth time this crop year and the recent back-to-back levels of 90% or better is the first seen since week 4.
As seen on the blue line of the attached chart, Canadian National Railway posted a significant improvement in week 32, moving from spotting 50% of the cars wanted to 75% of the cars wanted during one week, while has yet to reach the 90% threshold this crop year. The coalition's 2020-21 week-1 report indicates that CN performance had fallen below the 90% threshold for the ninth consecutive week. It does appear that this is actually the eighth week, with performance slipping below the 90% threshold in week 46 of the 2019-20 crop year.
During the first 32 weeks of the crop year, CN has spotted an average of 69.6% cars ordered in the week wanted, CP has spotted an average of 84%, while combined, both railroads have averaged 77% of cars spotted when wanted.
P[L1] D[0x0] M[300x250] OOP[F] ADUNIT[] T[]
To-date this crop year, hopper car demand is reported at 312,923 cars, 12% higher than a year ago and 14.8% higher than the three-year average.
When it comes to unfilled demand this crop year, the elephant in the room is CN's unfilled demand for West Coast shipping. While CP's unfilled demand is reported at 2,754 cars, CN's unfilled demand is reported at 18,034 cars. Of this total, 58.2% or 10,503 hoppers is destined for the Vancouver bulk market channels, 19.2% or 3,467 cars are destined to Prince Rupert and an additional 2.7% or 491 cars are slated for the Vancouver Other/Western Canada market.
Of the 18,034 cars that represent CN's unfilled demand, 14,457 cars or 80% have been cancelled outright this crop year, or 97.7% of the total number of cars cancelled this crop year. This is only slightly better than the three-year average of 15,562 cars cancelled as of week 32, while CN has averaged 98.9% of the cancelled cars reported as of week 32 during the past three years.
The weeks ahead as Thunder Bay opens for the season and rail orders increase.
Cliff Jamieson can be reached at cliff.jamieson@dtn.com
Follow him on Twitter @Cliff Jamieson
(c) Copyright 2021 DTN, LLC. All rights reserved.


Comments
To comment, please Log In or Join our Community .