Canada Markets
Canola Exports Remain Strong
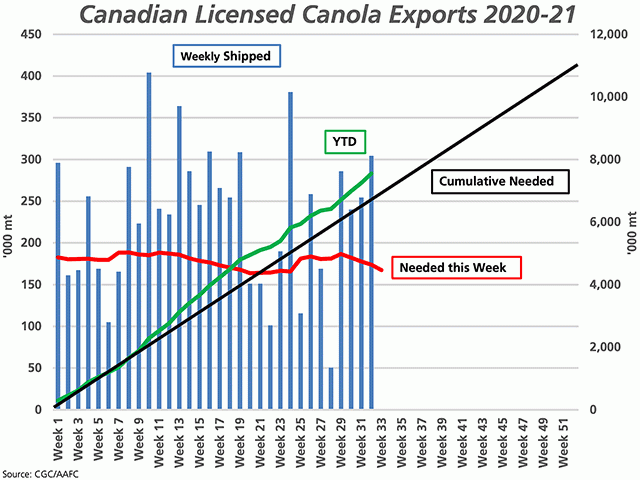
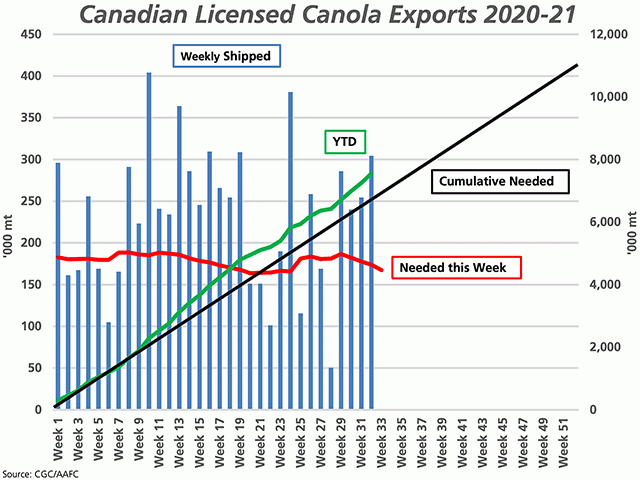
Canada's canola exports in week 32, or the week ending March 14, were reported at 304,500 metric tons, the largest volume shipped in eight weeks and well-above the 174,000 mt needed this week in order to stay on track to reach the current Agriculture and Agri-Food Canada export forecast of 10.9 mmt. Cumulative exports total 7.5509 million metric tons, up 30.7% from the same period in 2019-20 and 23.6% higher than the five-year average.
For four straight weeks, exports have exceeded the volume needed each week in order to reach the current AAFC export demand forecast and by a wide margin averaging 91,000 mt, as seen with the recent blue bars as compared to the red line on the attached chart. Over the balance of the crop year, only 167,455 mt of licensed exports are needed each week in order to reach the current forecast, which compares to the average exports for the past four weeks of 271,225 mt.
P[L1] D[0x0] M[300x250] OOP[F] ADUNIT[] T[]
Over the past five years, an average of 59.6% of total crop year exports were achieved as of the licensed exports reported by the CGC for week 32, or the first 61.5% of the crop year. This historical pace of movement projected forward would lead to crop year exports of 12.7 mmt, clearly an impossibility given a lack of exportable supplies.
Producers delivered 428,600 mt into the licensed handling system in week 32, down only slightly from the previous week, slightly more than the same week last crop year, while 20% higher than the three-year average for this week. Cumulative deliveries are reported at 14.2816 mmt, 18% higher than the three-year average.
When current forecasts for 2019-20 ending stocks on farm and 2020 production estimates from Statistics Canada are taken into account, cumulative producer deliveries account for 69.5% of the total available farm stocks as of week 32. This compares to the five-year average of 56.4%. This calculation points to roughly 6.3 mmt left on farm, which compares to the five-year average of 9.4 mmt and over 10 mmt at this time in each of the past two crop years.
It is interesting to note that despite the tightening stocks available, the basis reported for the nine regions of the Prairies by pdqinfo.ca has widened or weakened an average of $7.17/mt in the March 1 through March 19 period, of which an average of $3.98/mt was the weakening seen in trader for the week of March 15. This is a week that saw the nearby May contract also lose $24.90/mt. Cash prices on Friday were shown to range from $737.05/mt to $756.23/mt ($16.72 to $17.15/bu).
Cliff Jamieson can be reached at cliff.jamieson@dtn.com
Follow him on Twitter @Cliff Jamieson
(c) Copyright 2021 DTN, LLC. All rights reserved.


Comments
To comment, please Log In or Join our Community .