Canada Markets
Major Swings in Dec. 31 Stocks Over 20 Years
The most recent Agriculture and Agri-Food Canada January supply and demand estimates shows only three crops forecast to see a year-over year decline in ending stocks in 2020-21, with a modest drop of 260,000 metric tons forecast for corn, an even smaller drop of 34,000 mt for lentils and a record year-over-year drop of 1.931 million metric tons for canola.
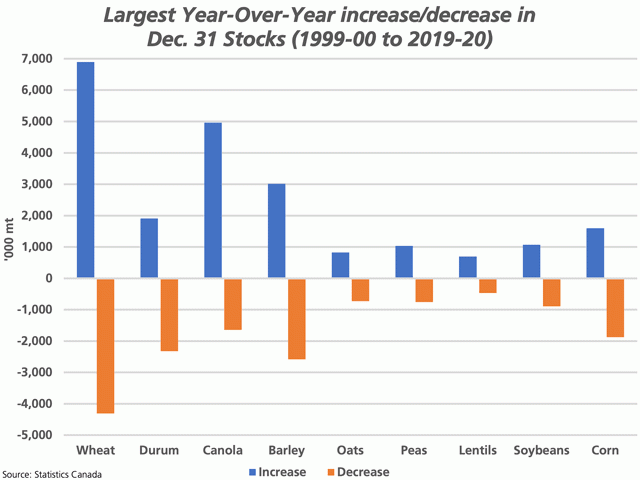
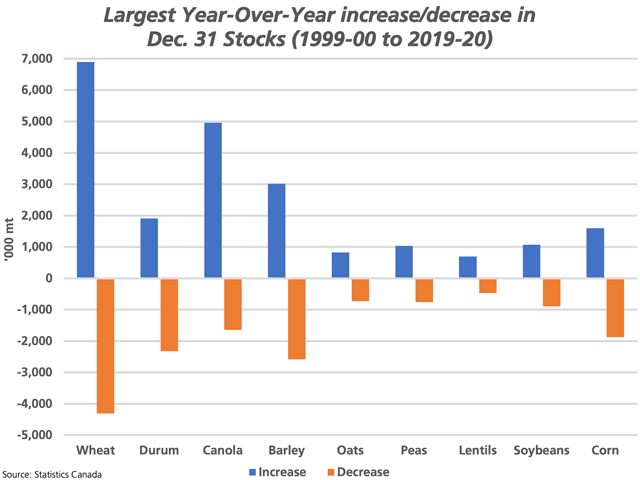
Statistics Canada data shows the December canola stocks rising during the past three years while also in five of the past seven years. During the past 20 years, the largest year-over-year decline is shown at 1.641 mmt that was reported for the 2001-02 crop year, while this figure could be easily surpassed.
P[L1] D[0x0] M[300x250] OOP[F] ADUNIT[] T[]
As seen on the attached chart, wheat stocks (excluding durum) are prone to the largest swings from year to year, increasing by 6.895 mmt from Dec. 2012 to Dec. 2013, while decreasing by 4.309 mmt from Dec. 2014 to Dec. 2015. The current AAFC forecast for January shows a year-over-year increase in ending stocks of 537,000 mt for 2020-21 wheat, the largest year-over-year increase seen for any crop.
At the same time, AAFC forecasts seem reluctant to factor in the pace of demand seen for several crops and the possibility exists for stocks estimates for both wheat and canola for this crop year are overstated, which could lead to surprises.
Cliff Jamieson can be reached at cliff.jamieson@dtn.com
Follow him on Twitter @CliffJamieson
(c) Copyright 2021 DTN, LLC. All rights reserved.


Comments
To comment, please Log In or Join our Community .