

Canada Markets
Technical Factors to Watch for Spring Wheat

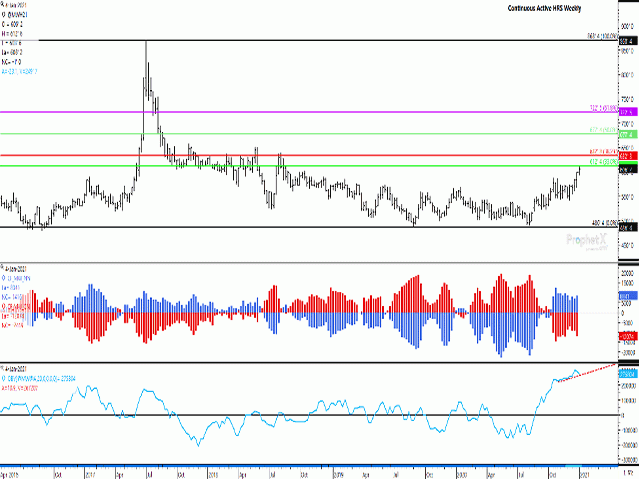
MGEX hard red spring wheat fundamentals remains viewed as the most bearish of the three major classes, at a time when global fundamentals remain bearish overall. At the same time, there is a number of chart signs seen this week that bears watching and could signal a turning point for prices.
Global wheat markets may be showing signs of stalling this week. Jan. 6 trade saw all three U.S. markets and Paris milling wheat give up early gains to finish in negative territory, led by winter wheat contracts. While all three U.S. wheat markets consolidated within Tuesday's range in sideways trade, European wheat futures for March delivery reached a fresh contract high this session only to change direction and close lower.
March HRS closed just 1 cent lower on Jan. 6, while forming a perfect doji bar or candlestick on the daily chart, with the session's open equal to the session's close. This is viewed as a sign of uncertainty and may be viewed as slightly bearish given the close in the lower one-half of the session's range.
As seen on the attached continuous active weekly chart, the recent move in the March MGEX spring wheat contract saw Tuesday's high test the 33% retracement of the move from the 2017 high of $8.68 1/2 per bushel (bu) to the 2019 low of $4.86 1/2/bu, calculated at $6.12 1/2/bu, although so far, has failed to sustain a move above this resistance.
P[L1] D[0x0] M[300x250] OOP[F] ADUNIT[] T[]
While this is a fresh two-year high, this remains far from the gains that has seen HRW reach its highest level since Jan. 2015 and SRW that reached its highest since Dec. 2014.
The second study shows noncommercial traders increasing their bullish net-long futures position in the week ending Dec. 28 (blue bars), while potentially influenced by the bullish sentiment gripping the row crop markets. At the same time, there is an increasing bearish net-short position reported for commercial traders (red bars), now shown as the largest net-short in five weeks and close to the largest net-short in nine weeks.
The blue line on the lower study points to a divergence taking place in the on-balance volume indicator. This indicator is calculated by adding daily volume on days when prices close higher, while subtracting daily volume on days when prices close lower. After reaching a recent high for the week of Dec. 21, this tally has fallen in the week of Dec. 28 and has fallen further so far this week. This signals that money is flowing out of the market and a signal that the upside move is faltering. The dotted red line shows the uptrend in this indicator during the past two months, while a crossing or downside breakout could signal a move lower ahead.
**
DTN 360 Poll
This week's poll asks how you view soybeans as a cropping choice for 2021. You can weigh in with your thoughts on this poll, located at the lower-right side of the DTN Home Page. We thank you for sharing your ideas.
Cliff Jamieson can be reached at cliff.jamieson@dtn.com
Follow him on Twitter @CliffJamieson
(c) Copyright 2021 DTN, LLC. All rights reserved.
Comments
To comment, please Log In or Join our Community .