Canada Markets
Canola Reaches Fresh Highs on Bullish Soybean Data
Today's bullish USDA data provided the bullish jolt needed for the canola market, a market that until now has been reluctant to push to fresh highs despite contract highs being realized in soybeans, palm oil and rapeseed trade.
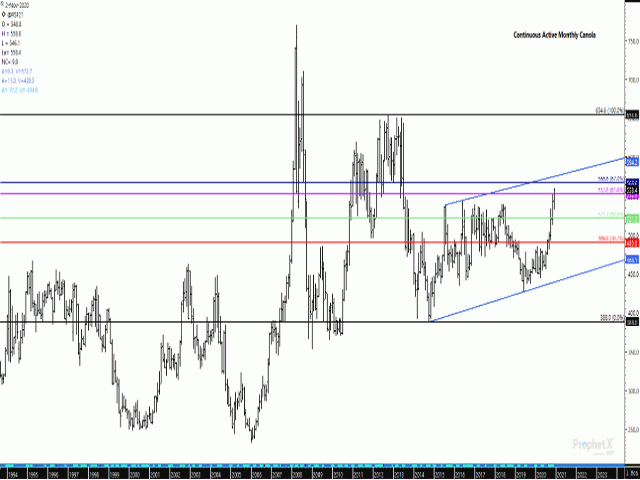
January canola finished $9.90/metric ton higher at $558.40/metric ton, a fresh contract high and only $0.40/mt below the session's high. This is the largest one-day move seen during the life of the contract with daily volume in the January contract the highest seen in nine sessions.
With new highs reached on the nearby chart, the question becomes where to we go from here? While not shown, the continuous active weekly chart shows three weekly highs ranging from $559.90/mt to $561.10/mt, only slightly higher than today's close while the only chart resistance seen preventing a move higher to a test of 2012-13 highs ranging from $645.70/mt to $654.60/mt, almost $100/mt higher than today's close.
P[L1] D[0x0] M[300x250] OOP[F] ADUNIT[] T[]
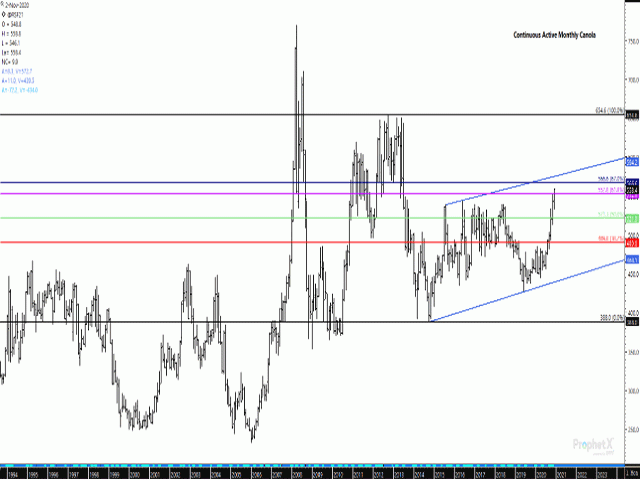
As seen on the attached chart, this week's move has seen the continuous active monthly chart move above the 61.8% retracement of the move from the Sept. 2012 high to the Sept. 2014 low at $552.80/mt. Further resistance on this long-term chart lies at $566.60/mt, the 67% retracement of this downtrend, while the upward-sloping channel shown by blue lines on this chart shows resistance at $572.70/mt.
Technical analysis theory would point to the potential for a measured move equal to the width of the channel in the event of a breakout, while this particular channel is roughly $131/mt wide which would see the highest levels seen since July 2008.
It's important to note that the USDA made few changes in its global forecast for canola/rapeseed, while today's move was all about soybeans. At the same time, should Statistics Canada follow suit and find a smaller canola crop when it releases its updated estimates on Dec. 3, canola would have its own bullish data driving prices higher.
Note that ICE Canada canola will not trade on Nov. 11 (Canada's Remembrance Day.)
Cliff Jamieson can be reached at cliff.jamieson@dtn.com
Follow him on Twitter @Cliff Jamieson
(c) Copyright 2020 DTN, LLC. All rights reserved.


Comments
To comment, please Log In or Join our Community .