Canada Markets
Canola Exports on a Roll
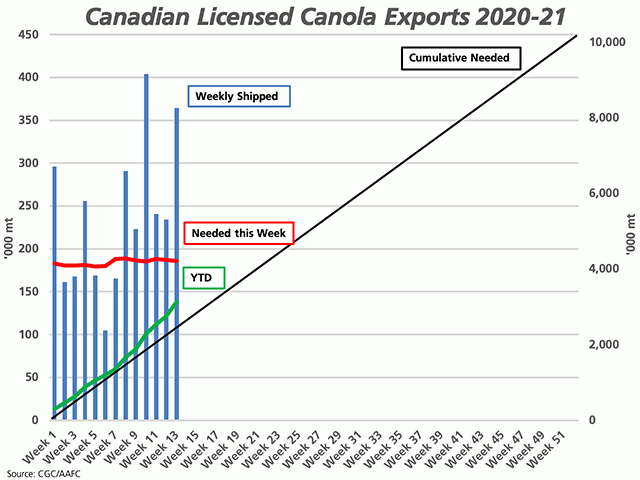
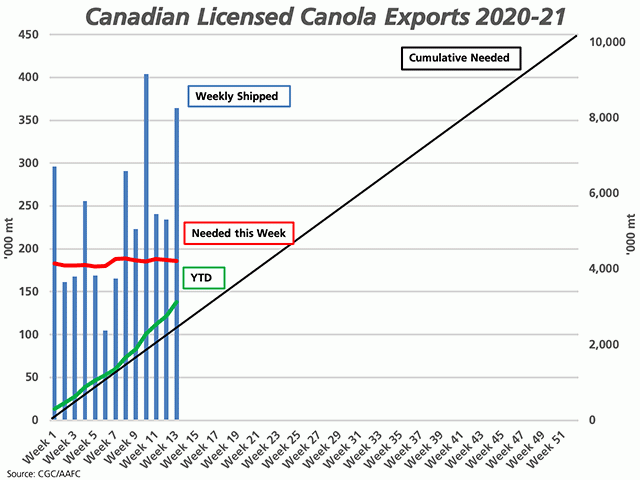
Canada's canola exports were reported at 364,100 metric tons in week 13, or the week ending Nov. 1, the highest volume shipped in three weeks and the second largest weekly volume shipped this crop year. The blue bars of the attached chart represent the weekly shipments, while the red line represents the volume needed each week to reach the Agriculture and Agri-Food Canada forecast.
We see that in eight of the 13 weeks, the volume shipped surpassed the volume needed for the week in order to reach the export forecast at the time, while by a significant amount in five of the eight weeks. Despite AAFC recently increasing its export forecast from 9.8 million metric tons to 10.2 mmt, week 13 shipments were still 178,500 mt above the volume needed to reach this forecast.
Year-to-date exports total 3.1263 mmt, up 47.7% from last year, up 36.6% from the five-year average and up 50.6% from the 10-year average. As can be seen on the attached chart, cumulative exports (green line) are well-above the steady pace needed to reach the current export forecast of 10.2 mmt (upward-sloping black line), by an amount of 576,300 mt over the first quarter of the crop year.
P[L1] D[0x0] M[300x250] OOP[F] ADUNIT[] T[]
While some commentary has pointed to slowing producer deliveries this week, week 13 data did not show this. Producers delivered 480,200 in the week ending Nov. 1, up from the previous week and 10.8% higher than the three-year average, despite the early 2020 harvest. Cumulative deliveries are reported at 5.997 mmt, up 15% from the same period last crop year.
How long this demand will last or how long producers will sell into this rally remains a mystery, while the overall supply of canola may be made clearer when Statistics Canada releases its final estimates for the 2020 crop on Dec. 3. While some analysts were reporting the highs in the market had been reached during the week ending Oct. 30, the January contract came within $0.30 of testing the contract high in Friday's trade. Cash prices across some, if not all of the nine regions or the Prairies monitored by pdqinfo.ca reached their highest trade since May/June 2018 this week, ranging from $506.91/mt to $519.40/mt across the nine regions on Nov. 5. Cash prices of $12 per bushel or $529.10/mt have been reported in forward positions.
The current pace of movement of 3 mmt/quarter would lead to a record 12 mmt exported this crop year and would lead to tight stocks of less than 500,000 mt, based on current government forecasts. Over the past five years, an average of 22.3% of total crop year exports were achieved as of the licensed shipments reported during the first 13 weeks, a pace of movement that would point to 14 mmt of exports. In 2019-20, only 20.8% of crop year exports had been achieved in the first 13 weeks, a pace that would point to even higher exports. One thing is certain, the supply of canola will soon be the focus should the current pace of movement continue.
In recent days, the International Grains Council posted a chart showing global canola/rapeseed stocks are forecast to fall by just over 1 mmt in 2020-21, a third consecutive global decline in stocks. This is the largest annual drop seen in their data in nine years, which they indicate is largely due to a drop in Canada's stocks. At the same time, the USDA's October World Agricultural Supply and Demand Estimates (WASDE) report was forecasting a 1.5-mmt drop in global stocks year-over-year, while estimating Canada's exports at 9.8 mmt, a forecast that should be revised higher when the USDA releases revised forecasts on Nov. 10.
The Nov. 10 USDA WASDE report bears watching for canola as well as oilseeds in general.
Cliff Jamieson can be reached at cliff.jamieson@dtn.com
Follow Cliff Jamieson on Twitter @Cliff Jamieson
(c) Copyright 2020 DTN, LLC. All rights reserved.


Comments
To comment, please Log In or Join our Community .