Canada Markets
December Spring Wheat Breaks Resistance
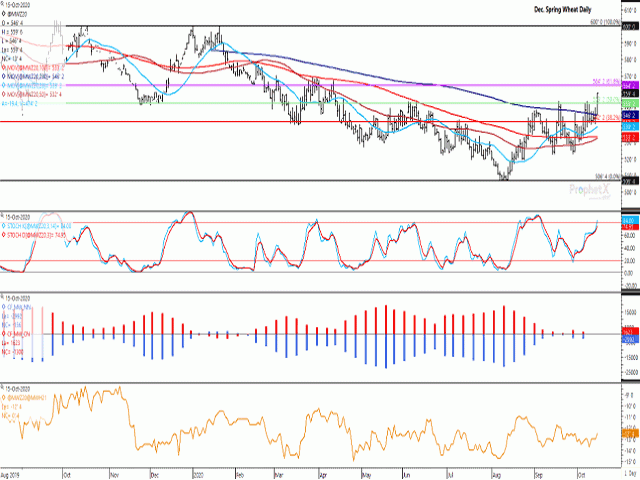
The bearish spring wheat data being released by the USDA, along with the overall bearishness of the global market with prospects of record global production and ending stocks in 2020-21 seems lost on wheat traders, with weather, both in the southern United States and Russia, taking center-stage. December MGEX spring wheat trailed winter wheat gains on Thursday, although broke resistance to closed 12 3/4 cents higher at $5.58 3/4 per bushel (bu), leading the gains achieved in later contracts.
Starting in early Wednesday trade, the December spring wheat trade was signaling a different kind of day, with all three wheat markets in the U.S. trading higher while row crops were facing pressure. While the December contract had failed to sustain a move above the contract's 200-day moving average in each of the past five days and in six of eight attempts since Sept. 18, overnight trade showed a higher open that resulted in the 200-day moving average acting as the low, or as support in overnight trade.
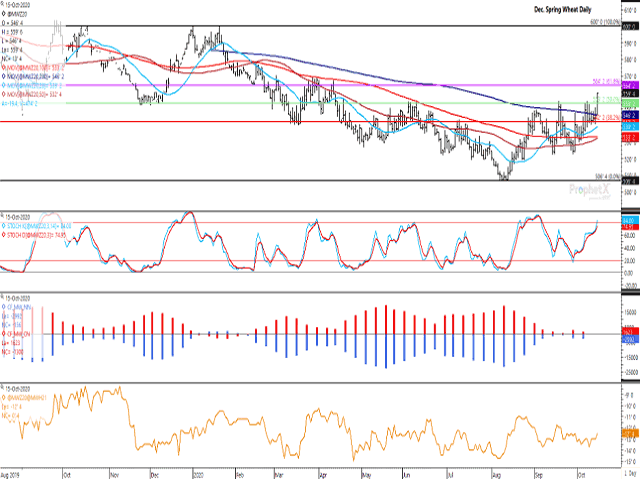
While Oct. 15 trade resulted in a rare close above the December contract's 200-day moving average, which is calculated at $5.46 1/4/bu, it also resulted in a rare close above the 50% retracement of the move from the contract's $6/bu double-top reached in January to the $5.06 1/2 low that was reached three times in four sessions from Aug. 7 to Aug. 12. This retracement is calculated at $5.53 1/4/bu, while a sustained close above this level could result in a continued move to the 61.8% retracement level at $5.64 1/4/bu. The next levels of resistance on the December chart are found at March/April highs ranging from $5.67/bu to $5.70 1/4/bu.
Another chart pattern could also be considered. In recent weeks, I pointed out the potential for a head-and-shoulders pattern signaling a market top, with the December chart showing a potential left shoulder formed in late-Aug./early Sept, a head formed on Sept. 18-21 while early Oct. trade showed the potential formation of a right shoulder.
P[L1] D[0x0] M[300x250] OOP[F] ADUNIT[] T[]
As pointed out today by DTN Contributing Analyst Tregg Cronin, a longer-term perspective on the weekly chart may be signaling an inverted head-and-shoulders pattern, or a bottoming signal, with the left shoulder formed in the late-April-through-July period, the head at the early August lows and the right shoulder formed in late-August through Sep. lows. If we view the neckline at the $5.56/bu level, the upside target is calculated based on the distance from the August low to the neckline ($5.56-$5.06 1/2 or 49 1/2 cents) added to the neckline. This signals a target of $6.06/bu.
The first study shows that prices on the daily chart (as well as the weekly chart that is not shown) have yet to reach overbought territory, supporting the potential for a continued move higher.
The middle study shows a modest net-long futures position held by noncommercial traders as of Oct. 5 (red bars) along with a modest net-short futures position held by commercial traders (blue bars). Despite the bearishness of the USDA data for U.S. spring wheat and global wheat markets in general, both sides of the trade are relatively close to neutral and are signaling caution. Noncommercial traders could play a significant role in moving prices to the upside should they move towards a bullish net-long position as seen reported for both soft red winter wheat and hard red winter wheat markets.
The lower study shows the Dec/March spread narrowing one cent so far this week to minus 12 3/4 cents. DTN analysis continues to point to more than 4 cents of carry seen per month as a bearish indication of demand and this bears watching.
**
DTN 360 Poll
This week's poll asks what you think will be the largest challenge faced this crop year? This poll can be found on the lower-right side of your DTN Canada Home Page. We welcome and thank you for sharing your opinion.
Cliff Jamieson can be reached at cliff.jamieson@dtn.com
Follow Cliff Jamieson on Twitter @Cliff Jamieson
(c) Copyright 2020 DTN, LLC. All rights reserved.


Comments
To comment, please Log In or Join our Community .