Canada Markets
Dry Pea Exports Off to a Solid Start
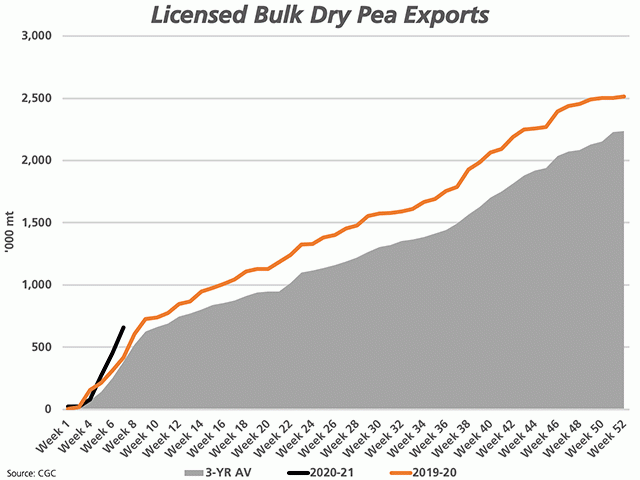
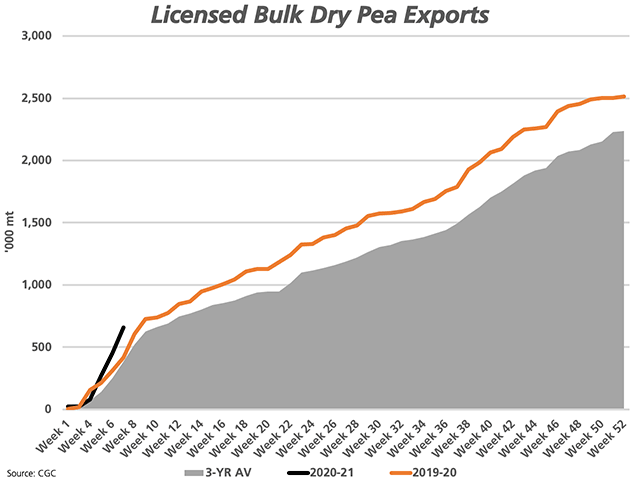
The black line on the attached chart shows the cumulative pace of dry pea exports for 2020-21, reported at 656,500 metric tons as of week 7, up 58.3% from the same period in 2019-20, 70% above the three-year average as shown on the chart and 23.3% higher than the five-year average. This is the fastest start since 2016-19, when 869,600 mt was shipped over the first seven weeks and contributed to the record 3.944 mt shipped over the crop year.
Over the first seven weeks of the crop year, producers have supported early movement, delivering 1.2756 million metric tons into licensed facilities, up 30.4% from last year and 42.7% above the three-year average. At the same time, commercial stocks held at the end of week 7 was reported at 532,600 mt, up 12.8% from the three-year average for this week.
If we look at data released during the past month, we see that Statistics Canada's model-based estimates based on July data led to a forecast of 4.996 mmt of production, while two weeks later, model-based estimates based on August data pointed to a crop size of 4.360 mmt, up only a modest 2.9% from 2019-20 and 636,000 mt lower than the first estimate.
At the same time, on Sept. 24, Agriculture and Agri-Food Canada's monthly supply and demand tables saw the export forecast revised 400,000 mt higher to 3.8 mmt, close to unchanged from 2019-20 and only partially offset by a lower revision in domestic disappearance. Stocks for 2020-21 are forecast to rise only modestly but remain tight at 250,000 mt, while these forecasts will be thoroughly tested this crop year.
P[L1] D[0x0] M[300x250] OOP[F] ADUNIT[] T[]
When the seasonality of pea exports is considered, we see than an average of 16.1% of total crop year exports was shipped through licensed facilities during the first seven weeks of the crop year during the past five years.
This pace projects forward to crop year exports of 4.078 mmt exported during the crop year, a volume that would lead to a negative stocks estimate based on current Agriculture and Agri-Food Canada forecasts. As well, movement during the first seven weeks of the crop year has been even slower during the past two crop years. On average, 9.85% of total crop year shipments have been executed over the first seven weeks of the crop year during the past two years, a pace that projects forward to even tighter stocks this crop year.
While the prairie pea crop is largely in the bin, prices are seen nudging higher. Price for yellow peas was shown as low as $6.56/bu delivered to Saskatchewan facilities as of mid-August, while reported by Saskatchewan's government at $7/bushels (bu) last week with Monday's statpub.com is reporting this bid at $7.20/bu of Monday.
While August export data has not been released by Statistics Canada or the Canadian Grain Commission, activity by China, India and Bangladesh during August bears watching.
**
DTN 360 Poll
This week's poll asks what you think of the most recent Statistics Canada model-based production estimates. You can weigh in with your thoughts on this topic on the poll, found on the lower-right side of your DTN Home Page. We thank you for your input!
Cliff Jamieson can be reached at cliff.jamieson@dtn.com
Follow him on Twitter @CliffJamieson
© (c) Copyright 2020 DTN, LLC. All rights reserved.


Comments
To comment, please Log In or Join our Community .