Canada Markets
A Look at Canola's Chart Resistance
As of the Sept. 17 close, the nearby Nov canola contract has closed higher in 15 of the past 19 sessions, closing lower twice and unchanged in one session. Over almost five weeks, the contract has gained $47.10 per metric ton (mt), or 9.7%, as market watchers on both sides of the Canada-U.S. border watch a counter-seasonal rally that has driven the entire oilseed and vegetable oil sector higher. In the case of canola, this falls during harvest, another reason to question the move.
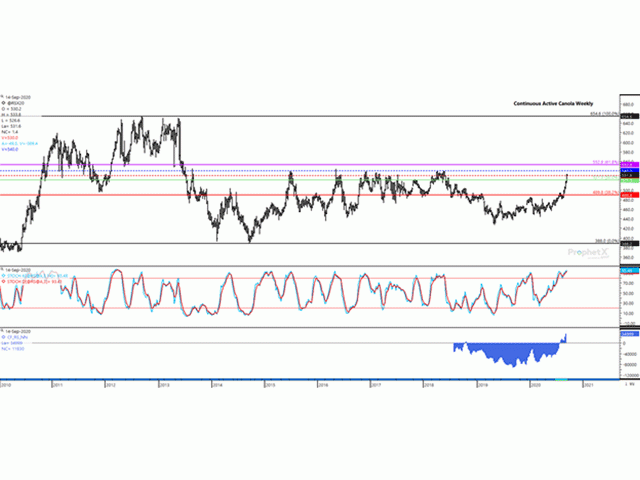
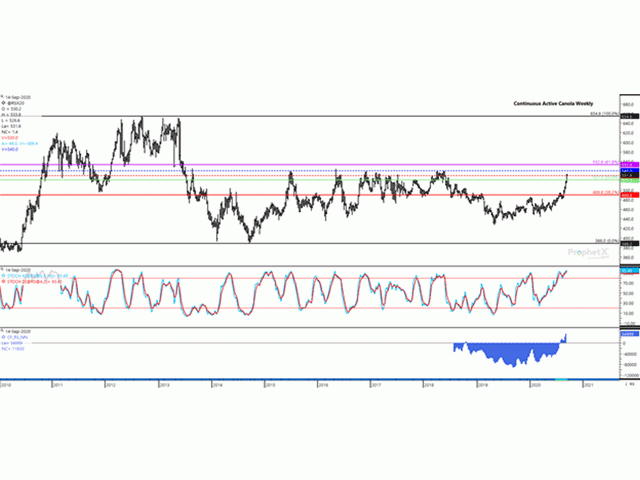
The attached chart is the continuous active weekly chart, signaling that prices over the past seven years have not spent much time trading in the vicinity of the current price levels.
We see on the attached continuous active chart that this week's move has taken prices into a range of resistance, shown by the red dotted line at $530/mt and the blue dotted line at $540/mt, that has acted to limit upside potential since late-August and September of 2013. We will look at the significance of this resistance and implications this may have on marketing decisions.
P[L1] D[0x0] M[300x250] OOP[F] ADUNIT[] T[]
Over this seven-year period, the weekly continuous active chart shows trade reaching levels above $530/mt in only 28 weeks. Trade reached levels above $540/mt on just two of those weeks, reaching a $544.60/mt high in May of 2016 and a high of $544.90/mt in August 2016. It is important to note that the weekly close was $28.80/mt below the high for the week noted in 2013, while $22.60/mt below the high for this week in 2016.
Of the 26 weeks where the weekly high fell in the $530/mt to $540/mt range, the weekly close landed above $530/mt in seven of 10 weeks in 2018, one of five weeks in 2017, zero of six weeks in 2016, two of four weeks in 2015 and failed to close above $530 in the single week in the last quarter of 2013. Over this seven-year period, the move into the $530/mt to $540/mt range led to a weekly close above $530/mt in just 10 of 26 weeks, or just 38.5% of the time.
Over the entire 28 weeks where weekly highs reached above $530/mt, the average weekly close was 2% or $10.88/mt below the high reached during the week.
The lower study shows the CFTC Commitment of Traders data for the period since August 2018 when canola data was first reported. Latest data as of Sept. 8 shows the speculative side of the trade growing their bullish net-long position in canola futures to a level not seen in the past. Sept. 17 DTN commentary points to this group still eager on the buy side, although history would indicate that they could soon turn nervous and be ready to take profits.
Cliff Jamieson can be reached at cliff.jamieson@dtn.com
Follow him on Twitter @Cliff Jamieson
© (c) Copyright 2020 DTN, LLC. All rights reserved.


Comments
To comment, please Log In or Join our Community .