Canada Markets
Saskatchewan Government Yield Estimates on the Radar
Sandwiched in between Statistics Canada's Aug. 31 release of model-based production estimates for Canadian crops based on July data, and the Sept. 14 model-based estimates based on August data, was estimates from the Saskatchewan government based on the old-fashioned boots-on-the-ground method, as of Sept. 7.
Previous DTN analysis has pointed to the weeks of hot weather in August and the potential for crop damage to late-seeded or maturing crops, while pointing to the odd tweet that expressed concern over the disappointing yields in some early harvest as heads/pods failed to fill due to the high temperatures faced. Statistics Canada's first production estimates of the season were based on July model-based data, which clearly missed this lengthy weather event.
This week's Saskatchewan Crop Report stated, "There are indications that the heat a few weeks ago has caused more damage in some crops than first anticipated."
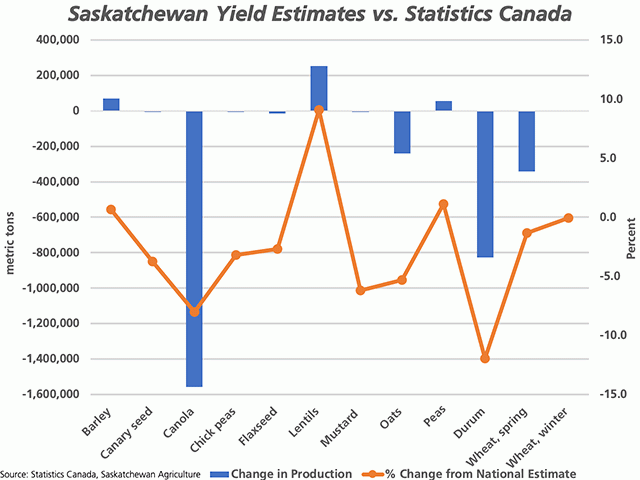
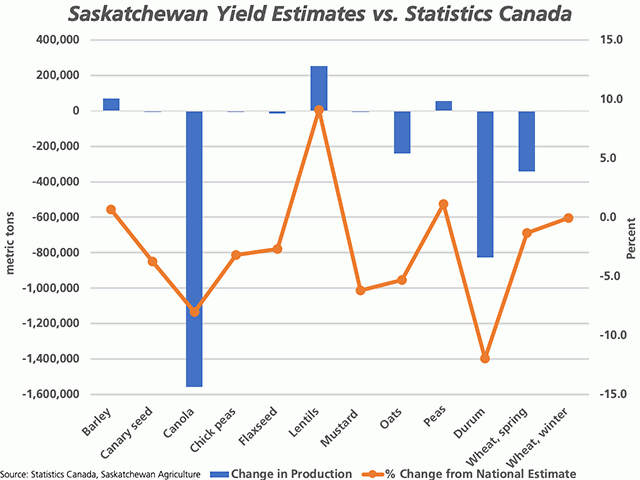
Of the crops shown on the attached chart, Saskatchewan's estimate for barley, lentils and dry pea yield was higher than the recent Statistics Canada estimate, while also higher than the five-year average yield reported by Statistics Canada. As seen with the blue bars on the attached chart, total production based on the provincial yield estimates combined with Statistics Canada's harvested acre estimates would result in a 69,015 mt increase in the estimated production of barley, a 254,098 mt increase in lentil production and a 55,718 mt increase in dry pea production.
Due to Saskatchewan's dominance in lentil production when compared to other provinces, this change in lentil production would represent a 9.1% increase in national production when compared to Statistics Canada's July estimates, as indicated by the brown line with markers, measured against the secondary vertical axis.
P[L1] D[0x0] M[300x250] OOP[F] ADUNIT[] T[]
The other nine crops included on the chart will all lead to a smaller crop than estimated by Statistics Canada when Saskatchewan yields are used in the calculation, although the change in several of these crops is minimal and barely registers on the chart. What does stand out is lower production of canola, durum, spring wheat and to a lesser extent, oats.
Saskatchewan Agriculture estimated the average provincial yield for canola at 35 bushels per acre, down from Statistics Canada's 41.1 bpa estimate and the five-year average of 40.1 bpa. Based on Statistics Canada's harvested acre estimate, this would result in a 1.558 million metric ton drop in production from Statistics Canada's July estimate to roughly 17.845 mmt, or the smallest crop in six years. Add this volume to Statistics Canada's recent July 31 stocks estimate of 2.7 mmt and you have crop year supplies of roughly 20.5 mmt, which falls short of meeting the total demand realized in 2019-20, bullish for the market and pointing to the need to ration demand this crop year. It's also important to note that the July 31 stocks estimate was made possible by an upward revision in 2018 and 2019 production of roughly 1.1 mmt.
One other crop that stands out is the change in durum production. Saskatchewan estimates the average durum yield at 38 bpa, well-below the 44.7 bpa estimated by Statistics Canada. This would result in a downward revision in production of 828,255 mt, or to 6.097 mmt nationally, which would still be the largest crop produced in four years. This would represent a 12% drop in the estimate for national production, based on Statistics Canada's July estimate of 6.926 mmt, as indicated by the brown line with markers. Add the 6 mmt production to the July 31 stocks of 660,000 mt and crop year supplies should still allow for a 5 mmt plus export program.
Saskatchewan Agriculture estimated the province's hard red spring wheat average yield at 45 bpa and the average of other classes at 49 bpa. Using the 2019 ratio of HRS to total spring wheat production, the average spring wheat yield is estimated at 45.3 bpa, which compares to Statistics Canada's 46.9 bpa estimate and leading to a 343,357 mt drop in production, or a 1.3% drop from Statistics Canada's July national estimate.
Based on the selected crops, overall production would be 2.6 mmt lower as a result of the Saskatchewan yield estimates. We look forward to this week's ideas from Alberta Agriculture, the Sept. 14 model-based report from Statistics Canada, as well as the implications for the crop as the harvest moves north following this week's historic frost event.
**
DTN 360 Poll
This week's poll asks what you think of the recent decision by Statistics Canada to report the July crop production estimates based on model results, rather than the traditional survey-based methodology, a move that is a part of a longer-term plan. Please feel free to share your thoughts on this poll, found on the lower-right corner of your DTN Home Page.
Cliff Jamieson can be reached at cliff.jamieson@dtn.com
Follow him on Twitter @Cliff Jamieson
© (c) Copyright 2020 DTN, LLC. All rights reserved.


Comments
To comment, please Log In or Join our Community .