Canada Markets
A Look at Canada-US Durum Production
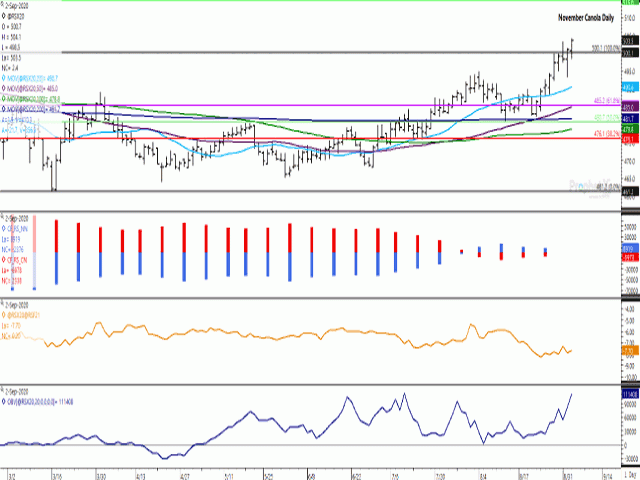
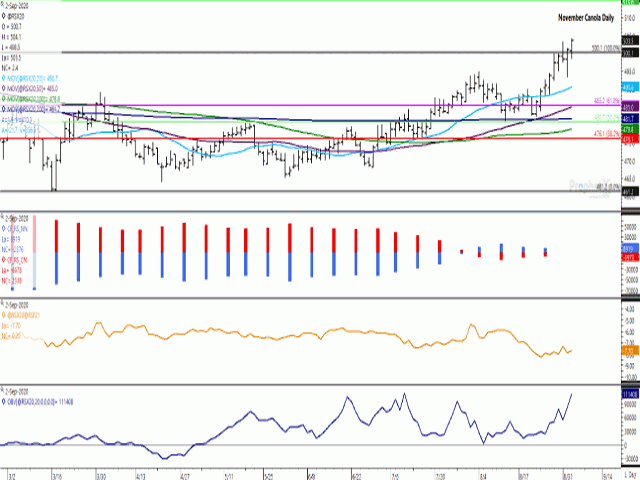
November canola reached a high of $499.80/metric ton on Aug. 27 and a high of $499.90/mt on Aug. 28. On Aug 31, a high of $503.20/mt was reached, although price slumped to close at $498.20/mt. After trading both sides of $500/mt on Sept. 1 and as low as $493.40/mt, price finally closed at $501.10/mt, near the upper-end of the session's trading range to reach a fresh 2020 high. Sept. 2 trade saw prices push even higher, ending up $2.40/mt at $503.50/mt, after once again trading as low as $498.50/mt. While the $500/mt mark briefly acted as resistance, recent trade shows this level now acting as support.
To put this move into perspective, the continuous active chart shows the last weekly close above $500 reported in October 2018, almost two years ago. Weekly highs on the continuous chart shows resistance at $504/mt, then again at $512.90/mt.
This week's move on the continuous active chart shows a breach of the 67% retracement of the move from the contract's May 2018 high to the May 2019 low on the continuous chart, calculated at $502.80/mt. A weekly close above this level clears a path to the $539.90 high, based on retracement theory.
Over the past 10 years, the November contract has lost an average of $14.08/mt in September trade. It is interesting to note that over this period, the monthly November chart shows a higher close in five of the 10 years and a lower monthly close in five of the 10 years.
What does jump out is the magnitude of the moves. Of the five years that the November contract has closed higher on the September monthly chart, the gains ranged from $1.70/mt to $16.40/mt, averaging a gain of $5.60/mt. Over the five years that the November contracts has lost ground in September, the losses ranged from $7.10/mt to $57.30/mt, averaging $33.76/mt.
P[L1] D[0x0] M[300x250] OOP[F] ADUNIT[] T[]
The fact that prices can go either way in September becomes more of a concern when one considers DTN's Price Probability Chart, which shows last week's weekly close of $499.10/mt at the 99th percentile of the nearby contract's price range for this week over the past five years.
Included on the attached chart (lower study) is the on-balance volume momentum indicator.
This indicator is seen trending higher, while close to reaching its highest level seen over the life of the contract. The line itself starts with an arbitrary number, while the daily volume is added when the price closes higher and is subtracted on days when the daily price finishes lower.
As stated by DTN Contributing Analyst Tregg Cronin, this is "implying more participation is being seen on up days than down." This becomes significant when one considers this week's breach of a psychological resistance level at $500.
At present, the trend remains your friend while the bulk of the harvest pressure remains ahead and this bears watching.
**
DTN 360 Poll
This week's readers' poll asks what you think of the recent decision by Statistics Canada to report the July crop production estimates based on model results, rather than the traditional survey-based methodology, a move that is a part of a longer-term plan. Please feel free to share your thoughts on this poll, found on the lower-right corner of your DTN Home Page.
Cliff Jamieson can be reached at cliff.jamieson@dtn.com
Follow him on Twitter @Cliff Jamieson
© (c) Copyright 2020 DTN, LLC. All rights reserved.


Comments
To comment, please Log In or Join our Community .