Canada Markets
A Look at Early Canadian Production Estimates
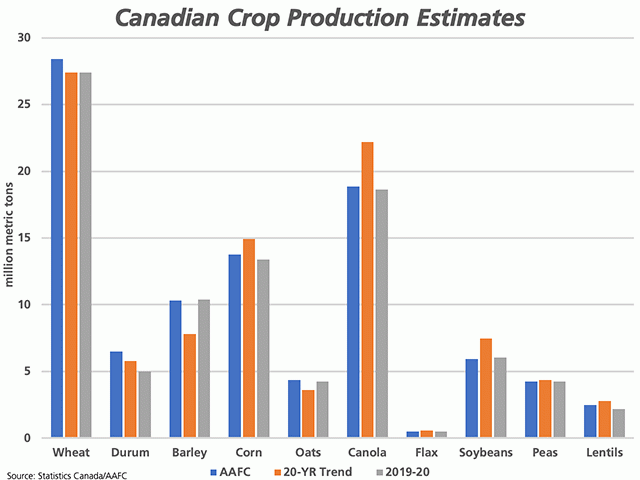
Agriculture and Agri-Food Canada's August Canada: Outlook for Principal Field Crops includes a production estimate for principal crops of 96.843 million metric tons, up from 93.394 mmt produced in 2019-20. Looking back through historical Statistics Canada data, this would be the second-largest crop produced, next to the roughly 98 mmt produced in 2013-14.
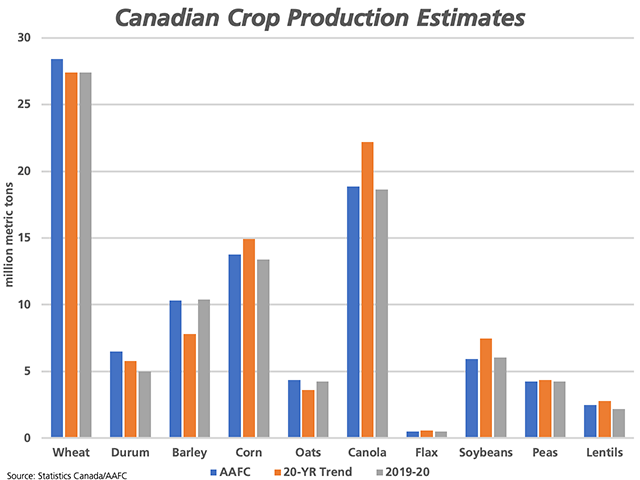
When AAFC's production estimates for specific crops are compared to 2019-20, the big obvious changes in year-over-year production is seen for wheat, up 1 mmt, durum up 1.523 mmt, corn up 346,000 metric tons, lentils up 308,000 metric tons, canola up 226,000 mt and oats up 123,000 mt. Of the selected grains on the attached chart, production is expected to fall year-over-year for barley (83,000 mt) and soybeans (105,000 mt).
The Aug. 31 Statistics Canada report will lead to debate, given the time frame that producer surveys were conducted. This report in 2019 was based on July 4-to-Aug. 5 surveys, while this time period in 2020 would fail to capture the extreme heat that trimmed the crop's potential in the western Prairies in August. Results from this report could very well be overstated as a result.
P[L1] D[0x0] M[300x250] OOP[F] ADUNIT[] T[]
The size of the crop along with the July 31 stocks that will be reported by Statistics Canada on Sept. 4 will prove significant in determining market direction in upcoming months. AAFC's supply and demand tables point to durum stocks increasing by 50% from 2019-20 to 2020-21, while also up 22.2% for spring wheat, 42.9% for barley, 80% for peas and 300% for lentils.
This week's Manitoba Crop Report points to wheat yields at average or slightly below average levels, with 88% of the winter wheat and 23% of the spring wheat off, as of Aug. 25. The later spring wheat harvest will be key in this province to meeting the current government forecasts, who are forecasting an average yield that is 5.4% higher than achieved in 2019.
After a 2 mmt, or 52.4%, drop in estimated canola stocks from 2018-19 to 2019-20, the largest year-over-year drop on record, stocks are forecast to drop a further 8.2%, or 150,000 mt, to 1.675 mmt as of July 31, 2021; this is only achieved by trimming the year-over-year demand forecast by 1.7 mmt. The 2 mmt year-over-year drop in stocks is the largest on record, while at a time when our exports to China were jeopardized by political issues. A surprise in the potential for the canola crop and/or in July 31 stocks or a sudden return by China could prove extremely bullish for canola, which at the time of writing has seen the November contract reach a $498.70/mt high and is nearing a test of 2020 high on the November chart at $500.10/mt. Spillover from gains across the soy complex are the major factors affecting today's canola trade.
**
DTN 360 Poll
This week's poll asks if you are concerned about the risks of COVID-19 as we move closer to harvest? You can weigh in with your thoughts on this poll, which is found on the lower-right side of your DTN Home Page.
Cliff Jamieson can be reached at cliff.jamieson@dtn.com
Follow him on Twitter @Cliff Jamieson
© (c) Copyright 2020 DTN, LLC. All rights reserved.


Comments
To comment, please Log In or Join our Community .