

Ag Weather Forum
Extreme Heat Characterizes Summer for Central and Western Corn Belt
It hasn't always felt that way this summer, but it was a rather hot one for large portions of the Corn Belt. Multiple stretches of extreme heat were noted over the central and Western Corn Belt this year, though they were interspersed with much milder temperatures for much of July. With the latest round of heat now out of the region, it is becoming less likely that we could see it return, as normal temperatures will continue to drop from here on out through the end of the year.
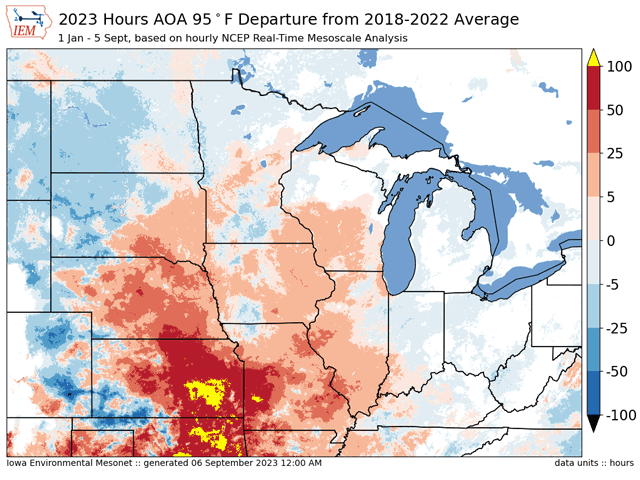
Instead of simple daily temperature averages, another way to describe the heat would be the amount of time over an extreme value. The Iowa Environmental Mesonet (IEM), run by Iowa State University, recently had a feature on their website characterizing this year's heat. In their analysis, the number of hours that have reached or eclipsed 95 degrees Fahrenheit has been well above the previous five-year average for much of the Corn Belt from eastern South Dakota to Wisconsin and points southward. Some pockets in Minnesota, Iowa and Illinois fell below the five-year average, but most areas saw some extreme values above normal. For instance, much of Nebraska, Kansas and Missouri have seen more than 25 hours of time over the 95-degree mark than usual. In southeastern Kansas, those values are over 100 hours, or more than four full days of extra heat that would bake crops in the field.
P[L1] D[0x0] M[300x250] OOP[F] ADUNIT[] T[]
You can find the feature on the IEM website here: https://mesonet.agron.iastate.edu/….
The extra heat correlates well with the U.S. Drought Monitor, and that has an inherent cause-and-effect relationship. Soils with less soil moisture heat up more quickly, because less of that incoming sunlight is used to heat up the water in the soils, which takes more energy to accomplish. In turn, higher temperatures decrease soil moisture, and a significant feedback loop can exist until a good rain breaks the cycle. The IEM feature also includes a map that overlays the U.S. Drought Monitor, and the correlation is easily noticeable. You can find that embedded there as well.
Hot and dry conditions have been interspersed with bouts of cool and wet conditions this summer as well, leading to variable crop conditions and potential yield. The latest stretch of hot and dry weather since mid-August finishes out a year riddled with extreme heat stress on crops.
The heat has been limited for other areas of the Corn Belt, however. Most of Indiana, Michigan, Ohio and Kentucky are below the five-year average, as are much of the Dakotas and northwest Minnesota. In the case of the Eastern Corn Belt, some negative anomalies can be attributed to better soil moisture, but also a stronger protective effect from the Great Lakes. Northeasterly winds have made it difficult for these areas to experience extreme heat from their western neighbors. In the case of the Northwest, the upper rim of the heat ridge usually resided just off to the south, with cooler Canadian air being more commonplace. Some closer-to-normal rainfall in many of these areas also helped.
To find more weather conditions and your local forecast from DTN, head over to https://www.dtnpf.com/…
John Baranick can be reached at john.baranick@dtn.com
(c) Copyright 2023 DTN, LLC. All rights reserved.

Comments
To comment, please Log In or Join our Community .