

Fundamentally Speaking
Soybean Stocks-to-Use Ratios, Price Action
Action in the old crop-new crop soybean spread has been interesting with the July/November 2020 soybean spread at a 12 1/4-cent premium on June 20 falling to a 17 1/4-cent discount by September 3, only to rebound to a 6-cent premium on October 12.
It now sits at a 4 1/2-cent discount as of December 11.
Other than last year, this is the first time as of December 11 that the July soybean futures is a discount to the November contract since 12/11/2006 when July 2007 soybean futures were a $0.1725 per bushel discount to the November 2007 soybean futures contract.
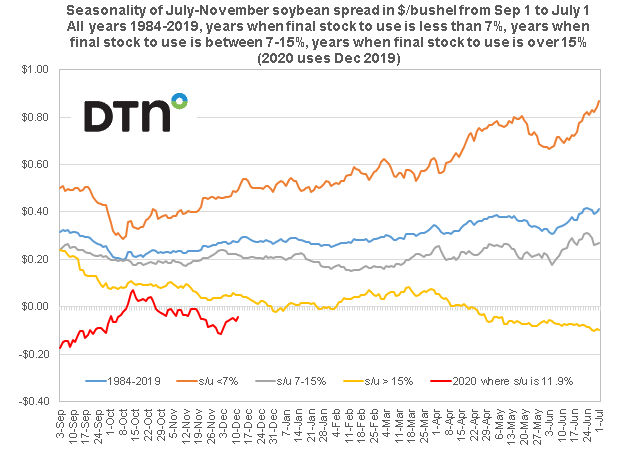
This graphic shows the seasonality of the July-November soybean spread in $/bushel from September 1 to July 1 for all years 1984-2019, years when final stocks-to-use ratio is less than 7%, years when the final stocks-to-use ratio is between 7-15% and years when the final stocks-to-use is over 15%.
P[L1] D[0x0] M[300x250] OOP[F] ADUNIT[] T[]
We have also included the July/November 2020 soybean spread and note that the December 2019 WASDE report issued this week maintained an 11.9% stocks-to-use ratio for the 2019/20 season.
As we indicated in the past, a tightening of the July-November soybean spread is linked to a low soybean stocks-to-use ratio while conversely July losing to November soybeans and perhaps going discount is seen when soybean supplies are ample and the stocks-to-use ratio is rather high.
It's no surprise then that when the stocks-to-use ratio is at 7% or less, July futures gain on December from the beginning of October all the way to the first of July.
On the other hand, the seasonal pattern when the stocks-to-use ratio is over 15% shows the July-November spread moving to a carry from the beginning of September to the beginning of July where old crop July expires discount to the new crop November contract.
It will be interesting to see how price action of the SN2020-SX2020 contract develops.
With the 2019/20 U.S. soybean stocks-to-use ratio currently pegged at 11.9%, it should follow the seasonal price pattern as traced out by the blue line that represents those years when the final U.S. soybean stocks-to-use ratio is between 7% and 15%.
Monitor how the spread reacts to the ongoing U.S.-China trade situation, the final 2019 production report 01/10/2020, the March 2020 planting intentions where the trade is anticipating a sizable increase in U.S. planted soybean area and spring 2020 weather.
(KLM)
© Copyright 2019 DTN/The Progressive Farmer. All rights reserved.

Comments
To comment, please Log In or Join our Community .