Canada Markets
January Data Shows Aggressive Canola Crush
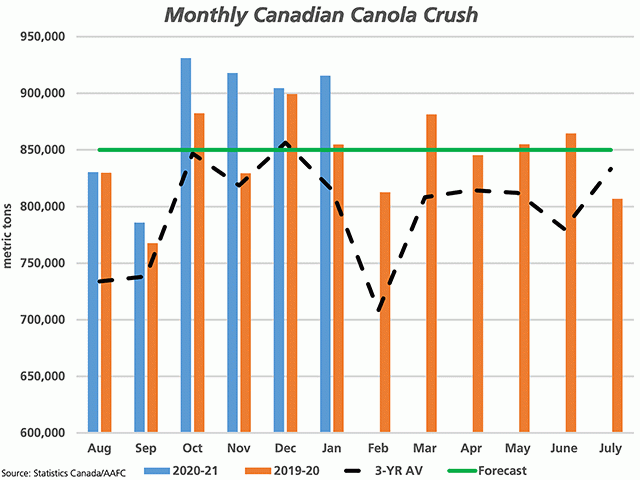
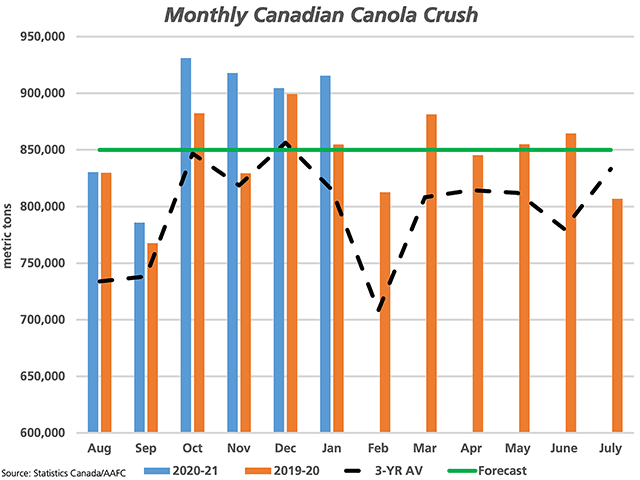
Statistics Canada reported today that Canadian crushers processed 915,553 metric tons of canola seed in January, up from the December crush and the third largest on record, with the top two months achieved in October and November of this crop year. A rally in soybean oil over the month, favourable crush margins, a 29-basis-point drop in the spot Canadian dollar and favourable winter weather over the month contributed to the higher activity.
The January crush was 7.1% higher than the same month in 2020 and was 12.4% higher than the three-year average. It was above the 833,000 mt needed this month in order to remain on track to reach the current Agriculture and Agri-Food Canada forecast of 10.2 million metric tons for the 2020-21 crop year.
The cumulative crush is calculated at 5.285 mmt, up 4.4% from the same period last year and 9.9% higher than the three-year average for the first half of the crop year.
P[L1] D[0x0] M[300x250] OOP[F] ADUNIT[] T[]
The oil produced in the January crush represents 43.1% of the seed crushed, down from 44% the previous month. During the first six months of the crop year, this averages 43.4%, which compares to 43.7% during the first six months of 2019-20 and the three-year average of 43.9%.
The need to ration demand due to tight available supplies has been discussed for some time, although no slowing of activity was seen in January. It may result in a showdown between exporters and crushers as they chase the last of the uncommitted supplies on the Prairies.
The nearby Canadian Canola Board Margin Index faced a roller-coaster move in January. Early in this month, this index was reported above $130/mt, was reported at $74.31/mt by mid-month, back to $104.11/mt by Jan. 20, down to $60.41/mt by Jan. 26 and increasing to $84.49 by the end of the month.
This same index reported for February may lead to the desired slowing in activity needed to ration demand. The index has trended lower since Feb. 8, while the nearby index based on the nearby March contract moved into a negative position of minus $3.21/mt as of Feb. 22. On the same day, the index was reported at $36.60/mt against the May contract and $59.10 against the July contract, before moving above $120/mt and even $130/mt in new-crop positions. Some difficult decisions may lie ahead.
Cliff Jamieson can be reached at cliff.jamieson@dtn.com
Follow him on Twitter @CliffJamieson
(c) Copyright 2021 DTN, LLC. All rights reserved.


Comments
To comment, please Log In or Join our Community .