Canada Markets
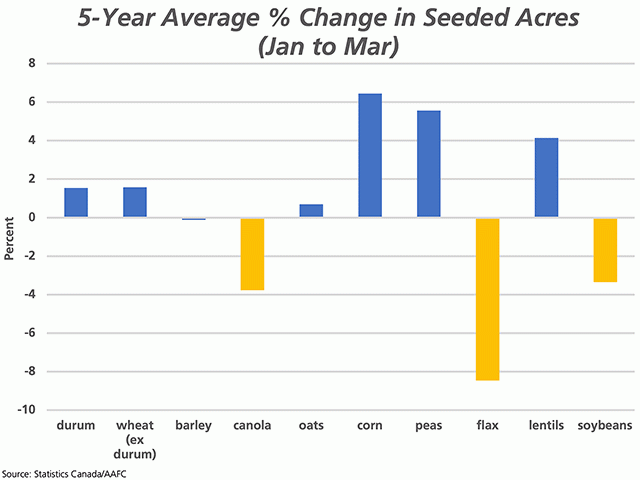
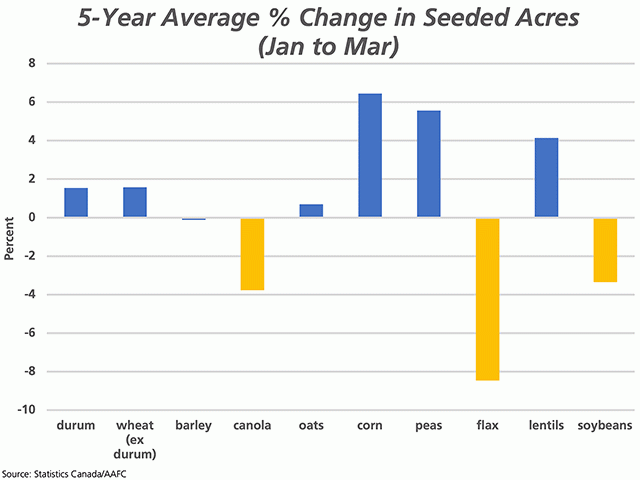
Five-Year Average Change in Seeded Acres, Jan-March
The jury remains out on just how producers will respond this spring in terms of seeded acres. We're seeing a significant push in the United States to expend row crop acres, while canola is currently trading in uncharted territory.
At the same time, many producers will follow their normal rotations, for a number of reasons, including disease control. Planting seed could be a limiting factor for some crops, while dry conditions in spring could have a bearing on what is planted. Despite the run in canola, an industry rep questioned why barley wouldn't be preferred due to the lower input costs. Indeed, the Saskatchewan 2021 Crop Planning Guide shows estimated variable expenses of $197.68/acre for barley on the dark brown soil zone, which compares to $339.96/acre for canola.
The attached chart looks at the five-year average of the difference between Agriculture and Agri-Food Canada's January estimates for seeded acres for the upcoming crop year and Statistics Canada's March Intentions data. The latter is based on producer surveys in March, while reported in late April or May, this year on April 27.
P[L1] D[0x0] M[300x250] OOP[F] ADUNIT[] T[]
The blue bars for durum, wheat, oats, corn, peas, and lentils represent crops where the initial AAFC estimate is understated. On average, the March Intentions report has led to a 1.5% increase in durum acres and a 1.6% increase in wheat acres. While durum acres have been reported higher in three of the past five years, wheat acres have been reported higher in March in four of the past five years.
The largest changes seen across the blue bars are seen for corn acres, along with peas and lentils. Corn acres have been reported higher in March in four of the past five years, averaging 6.4% higher, with a double-digit increase seen in 2016 and 2017 data.
Both pea and lentil acres have been reported higher in March in three of the past five years, although both were reported lower in 2020 in the March report. On average, the March Intentions acreage has averaged 4.1% higher for lentils and 5.6% higher for peas during the five years.
While the barley bar is a blue color, barley acres reported in the spring averaged 0.1% lower than in January, having been reported higher in three of the past five years in March while in both of the past two years.
The yellow bars indicate that acres seeded to the oilseed crops of canola, flax and soybeans tend to be over-stated in the January report. March Intentions soybean acres have averaged 3.4% lower for over the past five years, canola at 3.8% lower and flax at 8.5%. At the same time both movement opportunities and prices may see a deviation from this trend.
While this is in no way a forecast for the upcoming growing season, Mark Twain once said that "history doesn't repeat itself but often rhymes."
Cliff Jamieson can be reached at cliff.jamieson@dtn.com
Follow him on Twitter @CliffJamieson
(c) Copyright 2021 DTN, LLC. All rights reserved.


Comments
To comment, please Log In or Join our Community .