Canada Markets
A Look at Cumulative Deliveries as a Percent of Supplies
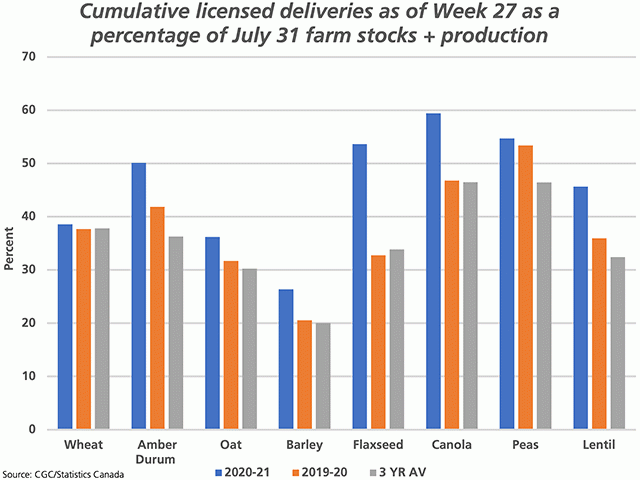
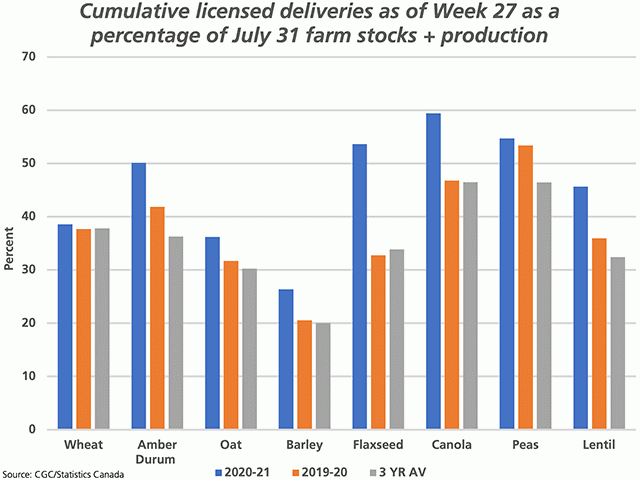
Supplies of several crops will be well-tested this crop year, while the attached chart signals which crops may be in line to experience this first.
Cumulative deliveries of all crops into licensed facilities as of week 27, or the week ending Feb. 7, is reported at 37.9413 million metric tons, up 15.7% from the same period in 2019-20 and 20.4% higher than the three-year average.
P[L1] D[0x0] M[300x250] OOP[F] ADUNIT[] T[]
Canadian Grain Commission data shows that cumulative wheat deliveries are up 6.3% from the same period in 2019-20, durum is up 34.7%, barley is up 32.9%, canola is up 14.3%, peas are up 10%, lentils up 23.8% and flax deliveries are up 88.5% from the same period last crop year.
The blue bars on the attached chart shows how this crop year's cumulative deliveries relate to available farm supplies (July 31 farm stocks plus estimated 2020 production). Of the selected crops, this calculation results in the highest percentage for canola, with deliveries during the first 27 weeks accounting for 59.4% of estimated farm supplies, which compares to 46.8% in 2019-20 (brown bar) and the three-year average of 46.5% (grey bar).
Other crops that are noticeably tight based on this calculation are peas at 54.7%, flax at 53.6% and durum at 50%.
Relative to this period last year, the largest changes are seen in the oilseeds, with this calculation resulting in a percentage for flax that is 20.9 percentage points higher (blue bar versus the brown bar), while is 12.6 percentage points higher for canola. This calculation for wheat deliveries in the first 27 weeks of the crop year is just 0.9 percentage points higher than 2019-20, while deliveries of durum are 8.2 percentage points higher than the previous crop year.
Cliff Jamieson can be reached at cliff.jamieson@dtn.com
Follow him on Twitter @CliffJamieson
(c) Copyright 2021 DTN, LLC. All rights reserved.


Comments
To comment, please Log In or Join our Community .