Canada Markets
Canada's Domestic Wheat Use Bears Watching
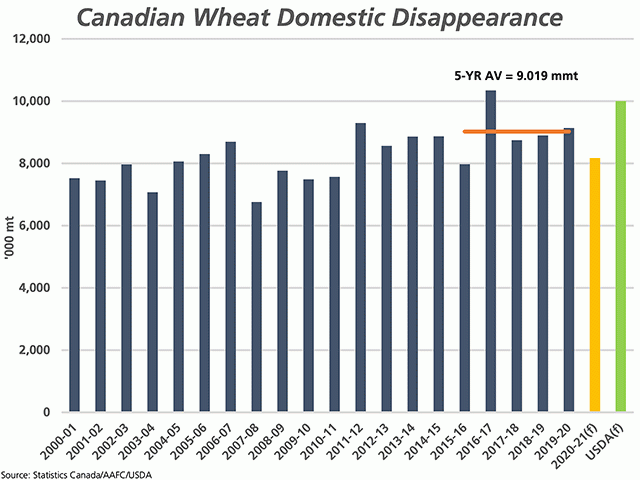
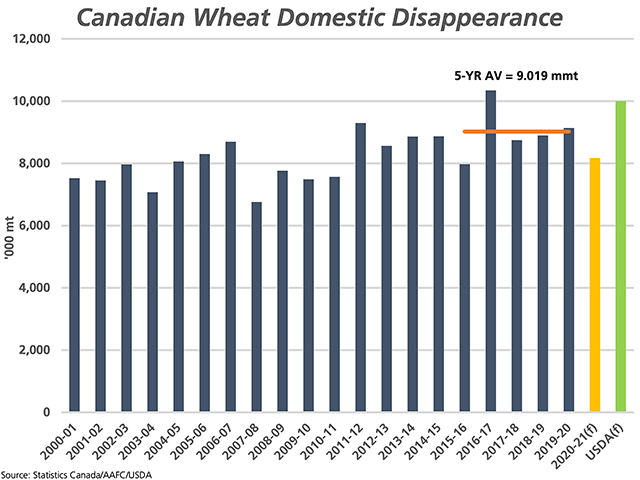
One estimate originating from this week's USDA World Agricultural Supply and Demand Estimates (WASDE) report that bears watching is the estimate for Canada's domestic disappearance of wheat (including durum), which was revised 400,000 metric tons higher this month by the USDA to 10 million metric tons, as indicated by the green bar on the attached chart.
This compares to Agriculture and Agri-Food Canada's January estimate of 8.166 mmt. It must be noted that the USDA's February data is released in the first two weeks of the month, while AAFC releases in the last two weeks of the month, so timing differences can be expected.
As discussed during recent months, Canada's government forecasts for wheat exports have been slow to react to the pace of actual movement, taking a more cautious approach. The monthly AAFC forecast for all-wheat exports rose from 24.3 mmt in August to 24.97 mmt in December, only to be revised by almost 1.5 mmt higher in January to 26.4 mmt.
The USDA, on the other hand, revised its forecast for Canada's exports from 25 to 26 mmt in December, then a further 500,000 mt higher in January to 26.5 mmt.
P[L1] D[0x0] M[300x250] OOP[F] ADUNIT[] T[]
Will the same happen with the forecast for domestic disappearance? The current spread between AAFC's forecast of 8.166 mmt and the USDA's 10 mmt is significant. While current AAFC forecasts point to ending stocks rising 751,000 mt or 13.7% year-over-year to 6.250 mmt, the highest in three years, the USDA's forecast indicates a fall of 15.8% year-over-year to 4.63 mmt which would be the lowest stocks realized since the 2007-08 crop year.
Tighter stocks of Canadian wheat could have a significant effect on markets overall as Russia, the world's largest exporter, initiates its tax on exports next week in order to slow the flow of exports, while spring wheat will face challenges on the Prairies and northern states when competing for acres this spring.
Statistics Canada data reported in the Supply and disposition of grains in Canada (32-10-0014-01) tables may provide a clue as to what to expect. This table shows domestic disappearance at 4.6338 mmt during the Aug. 1-through-Dec. 31 period. This volume is up 9.4% from the same period in 2019-20 and 9.5% higher than the five-year average, while the highest in four years. This can be broken down further to a 2% year-over-year increase in the human food category and a 17.2% increase in the feed category.
Statistics Canada tables also show January-through-July usage at 4.874 mmt in 2019-20, while averaging 4.5 mmt during the past five years. Even an average pace of disappearance would result in crop year disappearance that is 1 mmt higher than the current AAFC forecast, while the August-to-December data shows an above-average pace of disappearance.
The move higher seen in corn prices along with the export of barley has led to increasing volumes of wheat moved into feed channels. Alberta Agriculture's latest Weekly Crop Market Review shows feed wheat trading as high as $300/metric ton into Edmonton, $300/mt into Red Deer and as high as $305 into Lethbridge for the week of Feb. 1. When this is compared to pdqinfo's elevator cash bids of $285.50/mt for northern Alberta and $283.03/mt for southern Alberta for No. 1 CWRS 13.5% protein as of Feb. 11, along with $264.12/mt and $264.82/mt for No. 1 CPSR 11.5%, respectively, it is easy to see how disappearance into local feed channels would be appealing.
This week's Saskatchewan Market Trends shows the weekly No. 1 CWRS price reported at a $6.18/mt premium to Canada Feed wheat for the week ending Feb. 10, while two weeks ago this spread was shown at only a $1.35/mt premium. One year ago, this spread was $48/mt. Canada Feed wheat is reported at a $16.87/mt premium to the average No. 1 CPSR price, while one year ago CPSR was bid at a $19.54/mt premium.
This disappearance is consistent with a global trend to pull wheat into feed rations, with this week's WASDE report including a 5.4-mmt upward revision in global feed use (5 mmt in China and 400,000 mt for Canada), while total consumption was revised 9.78 mmt higher in total.
Cliff Jamieson can be reached at cliff.jamieson@dtn.com
Follow him on Twitter @CliffJamieson
(c) Copyright 2021 DTN, LLC. All rights reserved.


Comments
To comment, please Log In or Join our Community .