Canada Markets
Trend in AAFC's Forecast for Canola Exports
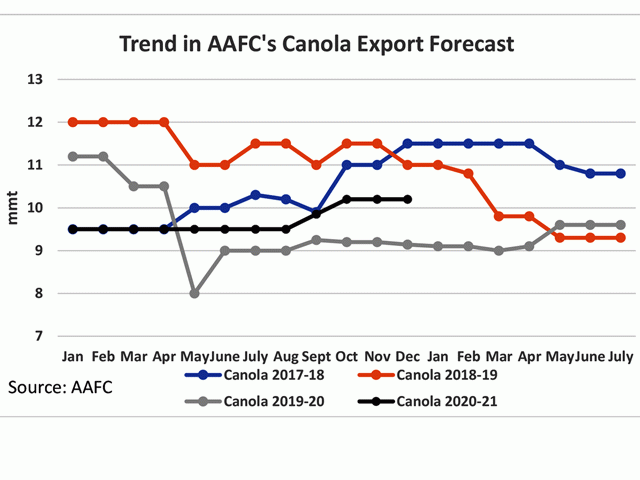
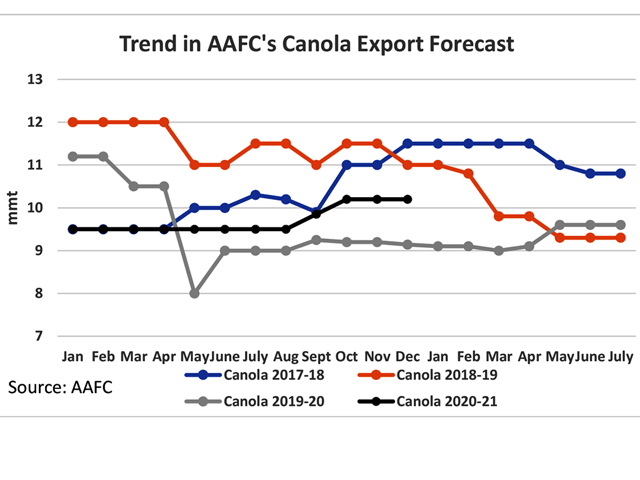
This month, Agriculture and Agri-Food Canada held the line on Canada's canola export forecast at 10.2 million metric tons, unchanged from October and November This is seen by the black line on the attached chart. This volume represents a modest 0.7% or 71,000 metric tons higher than reported exports for 2019-20.
Looking at the 2019-20 crop year (grey line), the forecast for Canada's canola exports increased by 500,000 mt from the December 2019 forecast to the final July 2020 forecast of 9.6 mmt. In 2018-19 (brown line), the forecast fell from 11 mmt to 9.6 mmt, or 1.4 mmt during this period while fell by 700,000 mt over the same period in 2017-18. On average, the forecast fell by 633,000 mt over this seven-month period during the past three years. While not shown, the chart for the three-year average canola export forecast shows the estimate being reduced in four of the final seven months this crop year.
Anyone watching the Canadian Grain Commission's weekly licensed export data would find the current forecast perplexing. As of week 19, or the week-ending Dec. 13, 4.7996 mmt has been exported, up 1.3654 mmt or 39.8% higher than the cumulative volume during the same period in 2019-20. While stocks are reported down sharply for 2020-21, the forecast 1.2 mmt is still well-above the 707,000 mt carried out of 2011-12 and the 588,000 mt carried out of 2012-13.
The current pace of movement is roughly 1.1 mmt higher than the steady pace needed to reach the current 10.2 mmt forecast. Fresh data will not be available until early January, with activity for weeks 19-22 combined.
P[L1] D[0x0] M[300x250] OOP[F] ADUNIT[] T[]
The last point plotted each year on the attached chart is the July estimate released by AAFC, just weeks in advance of the end of the crop year on July 31. As seen in Tuesday's Canada Markets Blog, when this same analysis was shown for Canada's all-wheat export forecast, we look at how the final forecast for the crop year compares to actual exports achieved over the crop year.
In three of the past five years (2015-16 through 2019-20), the final forecast released in July or the last month of the crop year is below the actual volume exported for the crop year, while in two of the five years, the forecast was higher. On average, final exports reported by Statistics Canada were 254,060 mt higher than forecast during this period.
In the two years where the final forecast was higher than the final crop year export total, the forecast came in close to the actual exports for the crop year, or within 100,000 mt for both years. In the three years where the final July estimate was below actual exports for the crop year, the miss was much larger. Over these three years, actual exports ranged from 299,000 mt above the forecast to as much as 570,000 mt above the forecast in 2019-20.
During recent months, Canadian forecasts 1) understated 2019-20 forecast exports when compared to actual exports 2) overstated the size of the crop with the July model data and the August model data arriving at the same estimate while missing the effect of the hot and dry August weather and 3) refuse to acknowledge the current pace of exports.
**
DTN 360 Poll
This week's poll asks if you think your area will benefit from increased biofuel production that is expected to take place as a result of Canada's Clean Fuel Standard that is soon to be released.
This poll can be found on the lower-right side of your DTN Canada Home Page. Thank you for your input.
Cliff Jamieson can be reached at cliff.jamieson@dtn.com
Follow him on Twitter @CliffJamieson
(c) Copyright 2020 DTN, LLC. All rights reserved.


Comments
To comment, please Log In or Join our Community .