Canada Markets
Trend in AAFC's Forecast for All-Wheat Exports
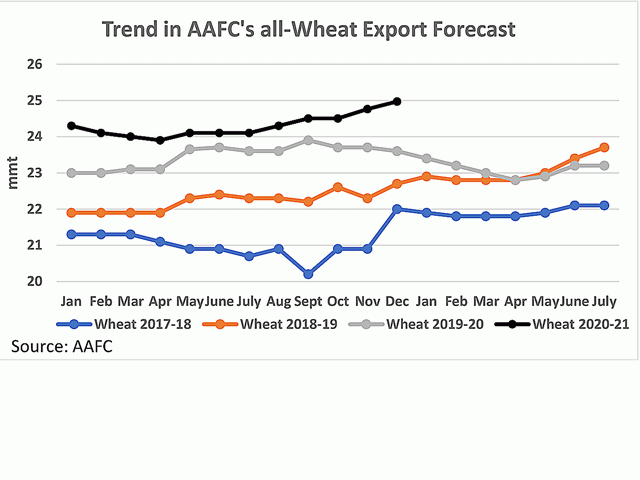
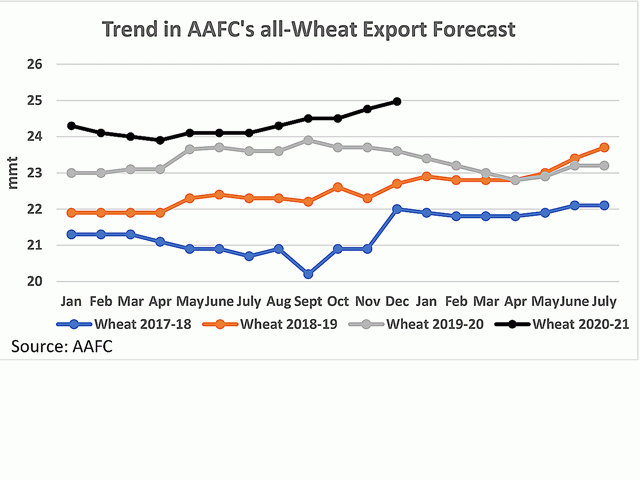
The December Agriculture and Agri-Food Canada supply and demand tables included an upward revision for Canada's wheat exports (excluding durum) of 200,000 metric tons to 19.650 million metric tons for 2020-21, while durum exports were revised higher by a modest 10,000 mt to 5.320 mmt. Canada's all-wheat exports forecast at 24.970 mmt are seen by the black line on the attached chart, estimated higher for a second straight month while higher for a fourth time in five months.
If achieved, this would be a fresh record movement, while note the USDA's December World Agricultural Supply and Demand Estimates (WASDE) report included a forecast for Canada's all-wheat exports at 26 mmt.
In 2019-20, the forecast for all-wheat exports declined by 400,000 mt from the December 2019 forecast to the final July 2020 forecast. In 2018-19, the forecast was increased by 1 mmt over this period while increased by 100,000 mt over the same period in 2017-18. On average, the forecast increased by a modest 233,333 mt over this seven-month period on average over the past three years. While not shown, the chart for the three-year average all-wheat export forecast shows lower estimates for January through April, followed by upward revisions for the final three months of the crop year.
P[L1] D[0x0] M[300x250] OOP[F] ADUNIT[] T[]
As of week 19, or the week ending Dec. 13, Canada's all-wheat exports total 9.6052 mmt, up 21% from 2019-20 and 24% higher than the three-year average for this period. The current pace of wheat exports is roughly 283,900 mt higher than the steady pace needed to reach the current wheat export target of 19.650 mmt (licensed exports only, excluding unlicensed exports and the export of flour), while the current pace of durum exports is roughly 198,000 mt higher than the pace needed to reach the current durum export forecast. All wheat exports (licensed shipments only) are approximately 481,900 mt higher the steady pace needed to reach the current 25 mmt all-wheat export forecast.
The last point plotted each year on the attached chart is the July estimate released by AAFC, just weeks in advance of the end of the crop year on July 31. It is interesting to note that AAFC's July estimate for the crop year exports fell below actual exports in three of the past five years (2015-16 through 2019-20). The largest variance is seen for data for the past two crop years, with the July 2019 forecast for the 2018-19 crop year 564,000 mt below the final export tally for the crop year, while the July 2020 forecast for the 2019-20 crop year was 1.271 mmt below the final reported exports for the crop year. Over five years, the final July estimate averaged 321,520 mt below the crop year's actual exports.
**
DTN 360 Poll
This week's poll asks if you think your area will benefit from increased biofuel production that is expected to take place as a result of Canada's Clean Fuel Standard that is soon to be released.
This poll can be found on the lower-right side of your DTN Canada Home Page. We thank you for your input!
Cliff Jamieson can be reached at cliff.jamieson@dtn.com
Follow him on Twitter @CliffJamieson
(c) Copyright 2020 DTN, LLC. All rights reserved.


Comments
To comment, please Log In or Join our Community .