Canada Markets
December Spring Wheat shows Early Signs of Chart Weakness
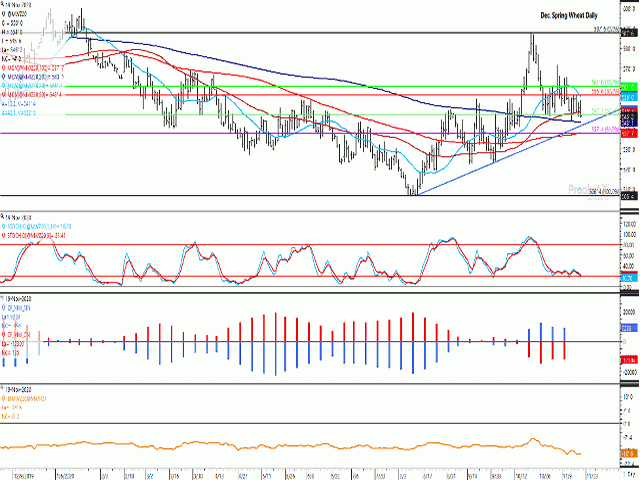
The Nov. 19 spring wheat close could be viewed as bearish. The December contract lost 4 cents to close at $5.46 1/2/bushel (bu), its lowest close in more than one month while printing a bearish outside bar on the daily chart. Trade remains bound within the previous week's trading range in sideways trade, although today's close was closer to the lower end of the range.
While the contract's 50-day moving average (red line) has acted as a supportive feature during the past four sessions, today's close was the first to end below this support at $5.48 1/2/bu since Sept. 29. As well, today's close was also the first to land below the 50% retracement of the move from the contract's August low to October high, as shown by the horizontal green line at $5.47/bu. Retracement theory would indicated that a sustained close below this level would result in a further slide to $5.37 1/2/bu, the 61.8% retracement of the same uptrend.
Potential support lies at $5.43/bu, the contract's 200-day moving average, along with trendline support at $5.41 1/2/bu, as seen on the upward-sloping blue line.
P[L1] D[0x0] M[300x250] OOP[F] ADUNIT[] T[]
Despite the growing speculative net-long position held by noncommercial traders of HRW, soybeans and corn, this group of traders has pared their bullish net-long position for soft red winter wheat for three consecutive weeks, while as seen with the blue bars of the histogram on the second study, have reduced their bullish net-long position in spring wheat for the past two consecutive weeks as of Nov. 10.
While not shown, the forward curve for hard red spring wheat (a line chart that connects each consecutive contract close) is upward-sloping and can be viewed as bearish through to March 2022. For example, today's December close for the MGEX spring wheat December contract at $5.46 1/4/bu ranges to $6.01 1/2/bu, as of March 2022, with each contract trading higher than the one prior to it.
This signals a bearish supply situation and can be compared with the oilseed market, such as canola. Each canola contract is inverted to the following contract from the January 2021 contract through the November 2021 contract, signaling solid front-end demand, a situation that may lead to producer selling due to a lack of carry in the market as buyers want grain sooner than later as reflected by the futures market.
**
DTN 360 Poll
This week's poll asks if your grain marketing decision-making process has changed from past years? Have you priced more or less than normal for this time of year? You can share your thoughts on this poll found on the lower-right side of your DTN Home Page.
Cliff Jamieson can be reached at cliff.jamieson@dtn.com
Follow him on Twitter @Cliff Jamieson
(c) Copyright 2020 DTN, LLC. All rights reserved.


Comments
To comment, please Log In or Join our Community .