Canada Markets
Disappearance/Commercial Stocks as a Percentage of Supplies
The Canadian Grain Commission's week 15 Grain Statistics Weekly, covering the week ending Nov. 15, continues to show favorable data with respect to grain exports and disappearance when compared to year-ago data. Commercial stocks are also reported higher than a year ago, favorable in a sense that this signals the likelihood of exports/use to follow.
The CGC reports that licensed exports of the principal field crops are up 31.2% or 3.8879 million metric tons from last year at 16.3537 mmt. Domestic use is reported up 271,000 mt, or 4.7%, from last year at 6.0378 mmt and commercial stocks are reported up 977,300 mt or 15.1% year-over-year at 7.441 mmt.
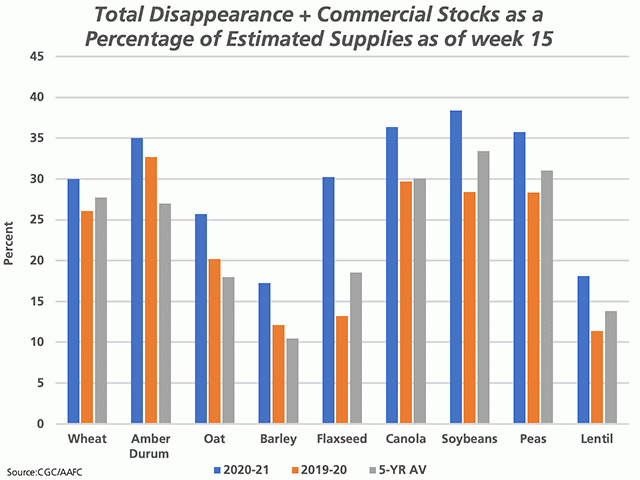
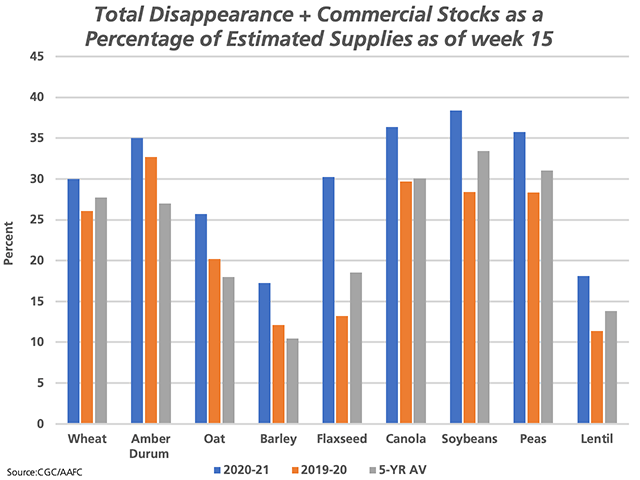
The attached chart compares the sum of these three numbers as a percentage of estimated crop year supplies as of week 15. Crop year supplies for the past five years (2015-16 through 2019-20) are official Statistics Canada estimates, while the 2020-21 supplies are based on Agriculture and Agri-Food Canada's October estimates.
P[L1] D[0x0] M[300x250] OOP[F] ADUNIT[] T[]
As seen on the attached chart, the percentage calculated for all selected principal crops for 2020-21 (blue bars) is higher than the same period in 2019-20 as well as the five-year average. The highest percentages are calculated for soybeans at 38.4%, canola at 36.4%, peas at 35.8% and durum at 35%.
When compared to recent years, flax data stands out, with the calculated percentage up 17 percentage points from last year and 11.7 points above average. Durum data follows, with the current volume calculated up 2.3 points from the same period last crop year while 8% higher than average. In both cases, a combination of higher exports and higher commercial stocks are reported. In the case of flax, licensed exports are 72% higher than the five-year average as of week 15, while commercial stocks are 35.3% higher. In the case of durum, exports are 31.6% higher than average, while stocks are 21% higher.
While there are no signs or reason to expect slowing demand, either on the export or domestic side of the equation, the data on this chart could point to the sensitivity of crop prices to revisions on the supply side. Statistics Canada's final production estimates will be released on Dec. 3, when this data will be updated for a fresh look.
**
DTN 360 Poll
This week's poll asks if your grain marketing decision-making process has changed from past years? Have you priced more or less than normal for this time of year? You can share your thoughts on this poll which is found on the lower-right side of your DTN Home Page.
Cliff Jamieson can be reached at cliff.jamieson@dtn.com
Follow him on Twitter @Cliff Jamieson
(c) Copyright 2020 DTN, LLC. All rights reserved.


Comments
To comment, please Log In or Join our Community .