Canada Markets
2019-20 Ending Stocks Projections Based on Historical Ratios
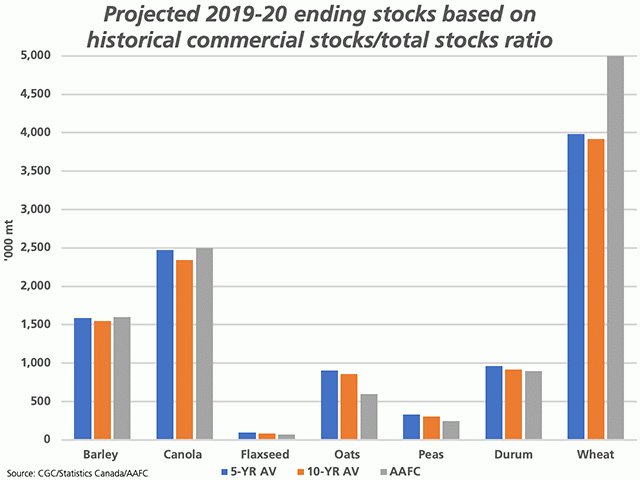
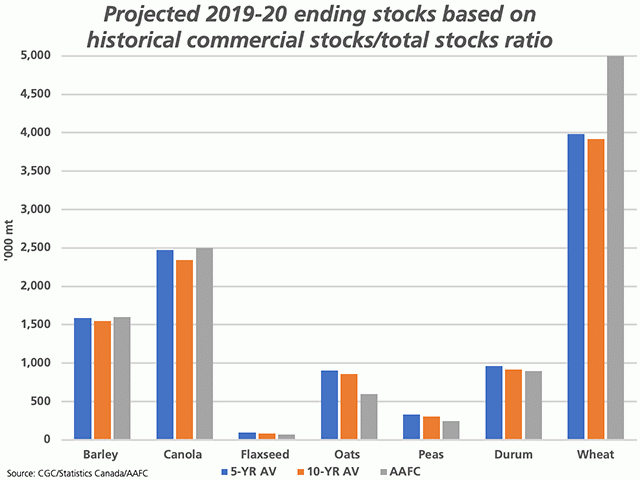
The attached chart looks at the historical relationship between Statistics Canada's official July 31 commercial stocks estimate as it relates to total ending stocks (farm plus commercial). From this data, both a five-year and 10-year average is calculated, which are used to project ending stocks for 2019-20 based on the Canadian Grain Commission's week 52 commercial stocks reported.
For example, over the past five years, commercial stocks of barley as reported by Statistics Canada have averaged 16.9% of the official total stocks estimate, while have averaged 17.4% over the past 10 years. Based on the CGC's week 52 report that shows commercial stocks of 268,400 metric tons for the week ended Aug. 2, this historical data may be used to project total stocks as of July 31, which includes an allowance for farm stocks. This calculation leads to stocks of 1.586 million metric tons (mmt) based on the five-year average and 1.546 mmt when the 10-year average is used. This is extremely close to the 1.6 mmt carryout that was released in AAFC's July supply and demand tables (grey bar).
While these projections across the selected crops are close to current AAFC forecasts, it is interesting to note that it does lead to higher projections for the carryout of oats and durum than is currently estimated by AAFC.
P[L1] D[0x0] M[300x250] OOP[F] ADUNIT[] T[]
The chart also shows that this calculation leads to lower wheat stocks projections than is currently forecast by AAFC. Over the past five years, commercial stocks of wheat (excluding durum) represented an average of 59.6% of total stocks, while an average of 60.5% of total stocks over the 10-year period. Based on the CGC's reported 2.372 mmt of wheat in commercial hands as of week 52, this projects forward to total ending stocks of 3.982 mmt based on the five-year average and 3.918 mmt based on the 10-year average. This compares to the current 5 mmt forecast released by AAFC in July and bears watching.
Statistics Canada will release official July 31 grain stocks data on Sept. 4.
DTN 360 POLL
This week's poll looks at readers' comfort level with the various crop condition assessments released by government for their particular area. You can weigh in with your thoughts in this poll, which is found at the lower-right of your DTN homepage.
Cliff Jamieson can be reached at cliff.jamieson@dtn.com
Follow him on Twitter @Cliff Jamieson
© (c) Copyright 2020 DTN, LLC. All rights reserved.


Comments
To comment, please Log In or Join our Community .