

Canada Markets
Saskatchewan Crop Report Points to Drier Conditions
Saskatchewan Agriculture's Crop report as of Aug. 3 shows the previous week being hot and dry at a critical time for crop development. This report follows the virtual crop tour results released by private analyst Farmlink that pointed to the potential for a record all-wheat production based on field inspections carried out over the last half of July, while noting the hot conditions and the fact that the crop was far from being in the bin.
The weekly rainfall chart shows the majority of the province receiving trace amounts to 5 millimeters (mm), with only two small areas seeing increased amounts ranging from 20 mm to 30 mm. The maximum temperature map shows the majority of the province seeing highs reach above 30 C, while a significant area in the southern and western area of the province reported highs exceeding 34 C.
This week's commentary by region points to some degree of increased stress to crops due to the dry conditions and heat across all six regions of the province. If we look at the Northwest Region of the province, where one location has received the most rainfall of any other point in the province at 418 mm (16.5 inches) and showed areas having surplus topsoil moisture in the July 27 report, commentary states: "Some have reported heat damage as well as stress due to lack of moisture. Rain would be welcome by many, especially in drier areas, during seed filling stage." Once again, this is the wettest area of the province, which surely must signal even greater issues in the drier areas.
P[L1] D[0x0] M[300x250] OOP[F] ADUNIT[] T[]
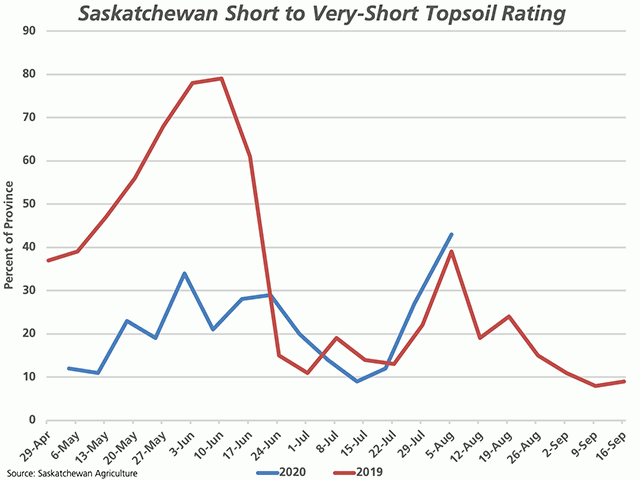
The attached chart shows the trend in the short- to very-short topsoil moisture assessment for the province for 2020 (blue line) and 2019 (red line). While this rating was much lower in 2020 for the May through late-June period, the estimate for the two years has been similar since. This rating was reported as low as 9% of the province as recently as July 9, while has climbed each week since to 43% as of Aug. 3.
This rating reached a high of 39% during the same week in 2019, with precipitation driving this area or percentage of the province lower in the following weeks, while supporting crop development during the filling stage. The current 7-day precipitation map shows only limited amounts forecast for the province.
DTN 360 Poll
This week's poll looks at the readers' comfort level with the various crop condition assessments released by government for their particular area. You can weigh in with your thoughts in this poll which is found at the lower-right of your DTN Home Page.
Cliff Jamieson can be reached at cliff.jamieson@dtn.com
Follow Cliff Jamieson on Twitter @Cliff Jamieson
© (c) Copyright 2020 DTN, LLC. All rights reserved.

Comments
To comment, please Log In or Join our Community .