Fundamentally Speaking
Soybean, Corn Stocks-to-Use Ratios
Both row crop markets seemed a little disappointed that 2020/21 carryouts were not lower in Thursday's S&D report.
There will be a slew of reports out January 12th including the quarterly grain on and off farm stocks as of December 1 and the final 2020 crop production of the year.
The January WASDE report based on the 12/1 stocks and final crop report the USDA will better able to determine what usage was in the September-November period, and if for some reason final 2020 corn and bean yields are significantly below last month's figure, UDSA will be in a real pickle as far as deciding which demand sector will see the most rationing.
The point is that the trade is probably looking at 2020/21 ending stocks lower than current corn and bean figures of 1.702 and 0.175 billion bushels (bb) respectively.
P[L1] D[0x0] M[300x250] OOP[F] ADUNIT[] T[]
Fact is there's a good chance of lower 2020 corn and bean yields in the final crop report next month.
The current export sales pace suggests USDA is still too light on current overseas sales projections, highly profitable crush soybean margins portending maybe additional increases in processing rate after a 15 million bushel boost last Thursday and uncertain weather in South America all provide solid reasons why values should hold in.
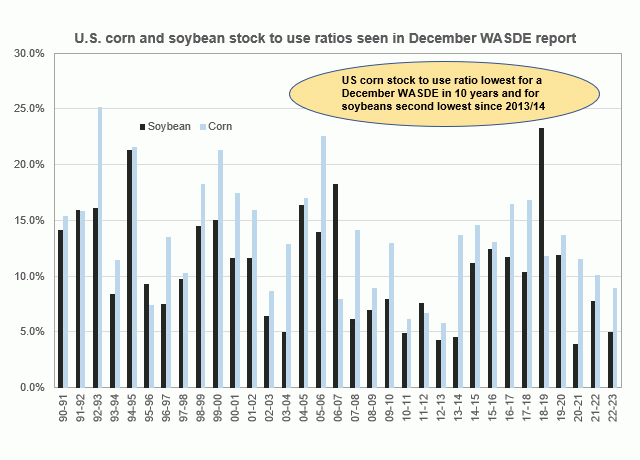
The fact is that once again USDA current soybean stocks-to-use ratio is the lowest ever for the December WASDE report as was the case last month, with the December U.S. corn stocks-to-use ratio the lowest for this month since the 2012/13 season.
This graphic shows the U.S. corn and soybean stocks-to-use ratios seen in the December WASDE report from the 1990-91 season compared to the figures furnished last week and the current soybean stocks-to-use ratio at 3.9% is the lowest ever.
This is well below the 30-year average of 11.0% and down from the lowest figure prior to this season in December 2012 when the 2012/13 soybean stocks-to-use ratio was 4.3%.
Interestingly the January 2013 soybean contract was trading at $14.96 per bushel on 12/14/2013 vs. the $11.68 level the January 2021 contract is trading at today.
One can also shake their head in amazement in that two years ago the December 2018 WASDE showed the largest December soybean stocks-to-use ratio ever at 23.3% and we are just two short years later and now have the tightest.
As for corn, the current stocks-to-use ratio at 11.5% is unchanged from last month, below the 30-year average of 13.8% and the lowest for December since December 2012 at 5.8% which is the tightest ever.
Note that two years ago in the December 2018 WASDE, USDA pegged the 2018/19 corn stocks-to-use ratio just slightly higher at 11.8%.
For reference the March 2019 corn contract was trading at $3.84 per bushel on 12/14/2019 vs. the $4.23 level the March 2021 contract is trading at today.
(c) Copyright 2020 DTN, LLC. All rights reserved.


Comments
To comment, please Log In or Join our Community .