Canada Markets
How Long will Farm Stocks of Canola Last?
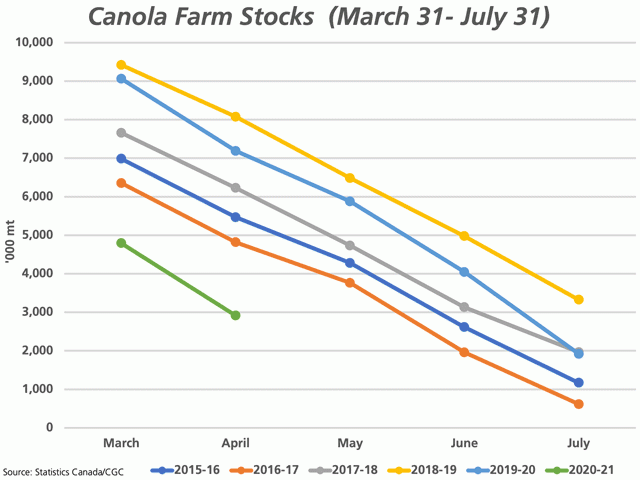
As of March 31, Statistics Canada estimated total canola stocks at 6.572 million metric tons, down 37.7% from last year, 30.2% below the five-year average and the lowest stocks seen since March 31, 2013.
Farm stocks fell by a greater amount, dropping by 47% over the past year and by 39% from the five-year average to 4.792 mmt, also the tightest farm stocks since March 31, 2013.
P[L1] D[0x0] M[300x250] OOP[F] ADUNIT[] T[]
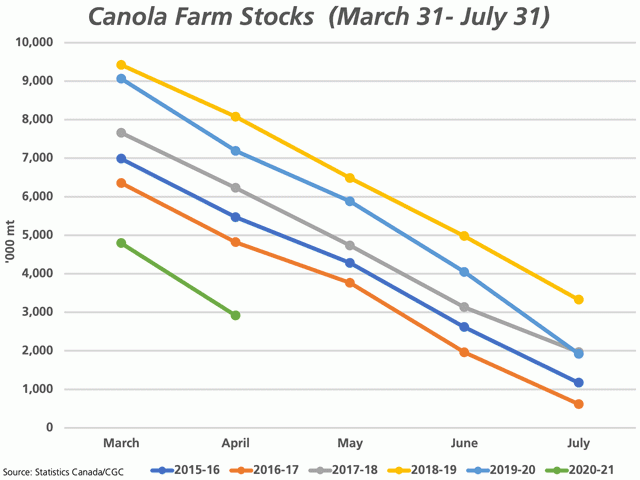
The attached graphic approximates the trend in farm stocks during the past five years, starting with Statistics Canada's March 31 estimate through to the end of the crop year at July 31. Each month, Statistics Canada's producer deliveries are deducted from the previous month's estimated farm stocks. The green line for the current crop year approximates this trend using the Canadian Grain Commission's week 35 through 39 data.
During the past five years, farm stocks have fallen from 5.694 mmt in 2017-18 to 7.144 mmt in 2019-20 over the March 31-through-to-July 31 period, averaging a drop of 6.0974 mmt when calculated using data for producer deliveries. For an unknown reason, this drop in stocks is slightly higher when comparing March 31 farm stocks to July 31 farm stocks reported by Statistics Canada, averaging a drop of 6.2602 mmt.
Regardless, farm supplies will be challenged in the weeks and months ahead if current estimates are correct. In week 39, 322,800 mt was delivered by producers while the previous four weeks shows an average volume of 389,325 mt delivered.
If the current estimates are accurate, many bin bottoms will be showing between now and the end of the crop year.
Cliff Jamieson can be reached at cliff.jamieson@dtn.com
Follow him on Twitter @Cliff Jamieson
(c) Copyright 2021 DTN, LLC. All rights reserved.


Comments
To comment, please Log In or Join our Community .