Canada Markets
A Look at Statistics Canada's March 31 Stocks Estimates
Bullish market watchers waiting for Statistics Canada's March 31 grain stocks were not disappointed on Friday, although the results of the report were not unexpected. In summary, of the major grains, only stocks of corn and rye rose over the past year, while stocks of all other crops fell, some by significant amounts.
When Canada's stocks of all grain are considered, the volume of major crops in storage totaled 41.983 million metric tons, down 16.3% from last year while the lowest volume see in five years. This situation is even tighter when farm stocks are considered, with 31.074 mmt estimated on farm as of March 31, down 21% from last year while the lowest seen in eight years or since March 2013. Given the significant demand faced, buyers will be challenged during the balance of the crop year while there will be a sharp focus placed on the 2021 crop potential.
Canada's all-wheat stocks (wheat plus durum) was reported at 16.231 mmt, down 13.6% from last year while 4.5% below the five-year average. This is the lowest all-wheat stocks seen in five years.
Further broken down, wheat stocks (excluding durum) was reported at 13.478 mmt, down 12.9% from March 2020 and equal to the five-year average. This is the lowest stocks reported for March in four years. Record wheat export demand continues to be a factor, with the most recent week 39 data showing exports of 531,600 mt, the largest volume shipped in 14 weeks and the third-largest volume shipped this crop year.
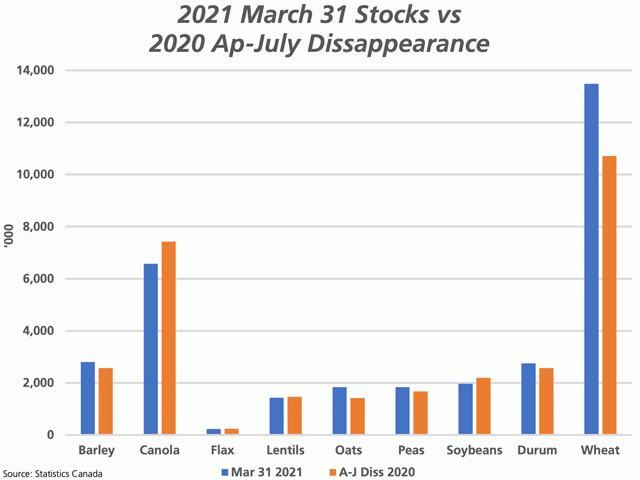
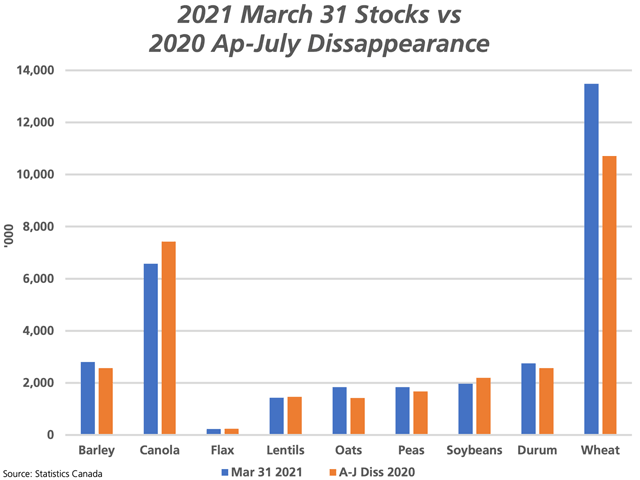
Current supplies of wheat are total 40.3% of estimated crop year supplies for 2020-21, which is the smallest percentage calculated since 1998. The attached chart shows that when the 2019-20 April-through-July disappearance is deducted from the March 31 stocks, you end with a volume of 2.765 mmt at the end of July 31 (blue bar exceeding the brown bar). Ending stocks this tight do not exist in Statistics Canada data going back to 1980, while the current pace of demand remains well-ahead of last year's pace.
P[L1] D[0x0] M[300x250] OOP[F] ADUNIT[] T[]
Durum stocks were reported at 2.753 mmt, down 16.7% from last year and 21.8% below the five-year average, the lowest seen in five years. As a percent of total crop year supplies, this volume represents 37.6% of what was available for the crop year, the lowest seen in six years. In 2019-20, disappearance in the April-through-July 31 period totaled 2.568 mmt, while current exports remain ahead of last year's pace. Given current estimates, durum stocks will be tight at the end of the current crop year.
Perhaps the most watched estimates were that released for canola today.
Canola stocks were estimated at 6.572 mmt, down 37.7% from last crop year and 30% below the five-year average. This signals amazing demand when one takes into account that the March 31, 2020 stocks were 17% higher than the previous five-year average. This volume is the lowest reported in eight years. Given estimates for 2020-21 crop year supplies, this represents just 29.9% of total supplies, down from 43.6% calculated for March 31, 2020 and the lowest percentage calculated in 22 years. The attached chart shows that stocks of 6.572 mmt compares to the 7.423 mmt that disappeared in the April-through-July period in the 2020-21 crop year (exports plus crush). At the time of writing, July canola is up $24.60/mt, consistent with recent moves, while the November contract is trading $1/mt lower.
Another crop facing an extremely tight supply is barley. Stocks were reported at 2.806 mmt as of March 31, down 20.5% from last year and 21.6% below the five-year average, the smallest volume reported in two years. Despite crop-year supplies reported by Statistics Canada at 11.863 mmt, the highest volume seen in 11 years, current stocks represent just 23.7% of crop-year supplies, the lowest percentage seen in data going back to 1997. As seen on the attached chart, the 2.8 mmt March 31 stocks compares to the 2019-20 April-through-July disappearance of 2.6 mmt, which would point to extremely tight stocks during the balance of the crop year.
Oat stocks were reported flat, down 0.1% from last year at 1.844 mmt, while is 1.7% higher than the five-year average. Agriculture and Agri-Food Canada is currently estimating tight oat stocks of 400,000 mt, while stocks could be even tighter and rival record lows.
Dry pea stocks were reported at 1.878 mmt, down 1.6% from last year and 3.3% higher than the five-year average. This is the lowest stocks reported in four years, while stocks will remain tight and close to 2019-20 volumes.
Lentil stocks were reported at 1.435 mmt, down 14.5% from last year while 7.5% higher than the five-year average. This is the tightest March 31 stocks in four years, while representing 45.5% of total estimated crop year supplies, also the lowest percentage calculated in four years. Solid demand in the final months of the 2019-20 crop year saw a volume similar to the March 31 volume disappear; lentil stocks will fall to pipeline levels this crop year.
Canada's soybean stocks were estimated at 1.967 mmt as of March 31, down 30.3% from a year ago and 23% below the five-year average. This would be the lowest March 31 stocks in four years, representing just 26.9% of total crop-year supplies. Soybean stocks are also heading towards zero (or as close as one can get), with disappearance in the April-through-August period in 2019-20 and on average during the past five years exceeding the current March 31 stocks.
Finally, corn stocks were reported at 8.147 mmt, up 1.9% from last year and 1.1% below the five-year average. An average pace of disappearance over the final months of the crop year should lead to Aug. 31 stocks close to the current AAFC forecast of 2.2 mmt, down from the 2.560 mmt reported for the year prior.
Cliff Jamieson can be reached at cliff.jamieson@dtn.com
Follow him on Twitter @Cliff Jamieson
(c) Copyright 2021 DTN, LLC. All rights reserved.


Comments
To comment, please Log In or Join our Community .