

Technically Speaking
Weekly Analysis: Corn and Soybean Markets
Corn (Cash): The DTN National Corn Index (NCI, national average cash price) closed at $3.45, down 8 cents for the week. The NCI has a double-top formation in place between its previous high of $3.57 and the recent peak of $3.56. A new secondary (intermediate-term) 3-wave downtrend would be confirmed if cash corn falls below the interim low of $3.37, a price that was also a test of support at the 33% retracement mark of the previous uptrend from $2.95 through the $3.57 high. The NCI also left a bearish gap between the previous week's low of $3.52 and last week's high of $3.50. This could be considered a breakaway gap, another bearish technical indicator for cash corn.
Corn (Old-crop Futures): The July 2018 contract closed 9 cents lower at $3.85 1/2. The contract remains in a secondary (intermediate-term) 3-wave downtrend. This would suggest July corn should move below the recent low of $3.77 1/2, possibly to a test of support near $3.71 1/2. This price marks the 76.4% retracement of the previous rally from $3.62 through the high of $4.02 3/4.
P[L1] D[0x0] M[300x250] OOP[F] ADUNIT[] T[]
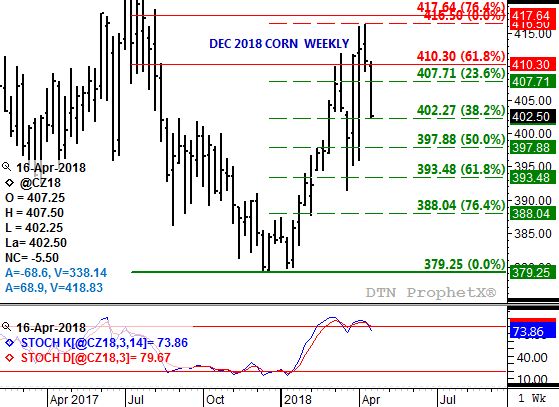
Corn (New-crop Futures): The December 2018 contract closed 8 1/4 cents lower at $4.02 1/2. The contract now looks to be in a secondary (intermediate-term) 3-wave downtrend with lower trade the last two weeks the early stages of Wave A (first wave). Last week's low of $4.02 1/4 was a test of the 38.2% retracement level of the previous 5-wave uptrend. The contract could rally off this support, moving into Wave B (second wave), or test the 50% and 61.8% retracement levels near $3.98 and $3.93 1/2 respectively. Weekly stochastics established a bearish crossover above the overbought level of 80% the week of March 12.
Soybeans (Cash): The DTN National Soybean Index (NSI, national average cash price) closed at $9.59, down 24 cents for the week. The NSI is in a secondary (intermediate-term) 3-wave downtrend. The end of the previous uptrend was signaled by a bearish reversal the week of March 5 that had a high of $9.98. Wave A (first wave) came to an end the week of March 26 with a low of $9.41, a test of support at $9.38. This price marks the 38.2% retracement level of the previous uptrend from $8.40 through the $9.98 high. Wave B (second wave) peaked at the previous week's high of $9.89, leading to the beginning of Wave C (third wave) that could now test support between $9.19 and $8.77.
Soybeans (Old-crop Futures): The July contract closed at $10.39 1/2, down 24 3/4 cents for the week. July soybeans' weekly chart remains a mix of technical signals. However, the most recent remains a bearish outside range the week of April 2 that could eventually lead to increased selling interest.
Soybeans (New-crop Futures): The November 2018 contract closed at $10.35, down 14 1/2 cents for the week. November soybeans look to be in the early stages of a secondary (intermediate-term) 3-wave downtrend. The week of April 2 saw the contract post a bearish outside week that included a new high of $10.60 before a lower weekly close. This price marks the peak of the previous 5-wave uptrend from the low of $9.23 1/2 (week of June 19, 2017). Weekly stochastics also posted a bearish crossover above the overbought level of 80% the week of April 2, confirming a move to a new downtrend.
To track my thoughts on the markets throughout the day, follow me on Twitter: www.twitter.com\DarinNewsom

Comments
To comment, please Log In or Join our Community .