

Technically Speaking
Weekly Analysis: Wheat Markets

SRW Wheat (Cash): The DTN National SRW Wheat Index (SR.X, national average cash price) closed at $3.90 3/4, up 1 1 /4 cents for the week. The weekly close-only chart remains one of the most interesting in the commodity sectors studied in this blog. The secondary (intermediate-term) trend has turned sideways between $4.06 1/4 (close the week of September 18) and $3.81 1/4 (close the week of August 21). A downside breakout would imply Wave C (third wave) of a 3-wave downtrend is in place with a target of $3.56 1/4. However, an upside breakout would imply that the previous sell-off from $5.03 through the low weekly close of $3.81 1/4 made up the previous downtrend, suggesting the market is in Wave 3 of the next 5-wave uptrend with a target of $4.31 1/4. Weekly stochastics remain bullish following a crossover below the oversold level of 20% the week of September 11.
SRW Wheat (New-crop Futures): The Chicago July 2018 contract closed at $4.71, down 3 cents for the week. Despite the lower weekly close, July Chicago wheat looks to have established a spike reversal on its weekly chart. This combined with the bullish crossover by weekly stochastics below the oversold level of 20% indicates the secondary (intermediate-term) trend has turned up. If so, the initial upside target is near $4.95 3/4, a price that marks the 23.6% retracement level of the previous downtrend from $6.09 1/2 through last week's low of $4.60 3/4.
P[L1] D[0x0] M[300x250] OOP[F] ADUNIT[] T[]
HRW Wheat (Cash): The DTN National HRW Wheat Index (HW.X, national average cash price) closed at $3.66 1/4, up 11 3/4 cents for the week. Cash HRW wheat is indicating a secondary (intermediate-term) 5-wave uptrend on its weekly close-only chart, though needs a close above the previous high weekly close of $3.70 1/4 (week of September 18) to confirm. This is also a test of the resistance at $3.71, a price that marks the 23.6% retracement level of the previous secondary downtrend from $4.73 3/4 through the low of $3.39 1/4. Weekly stochastics established a bullish crossover below the oversold level of 20% the week of September 11.
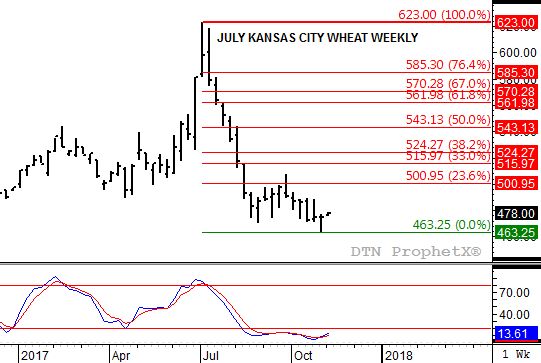
HRW Wheat (New-crop Futures): The Kansas City July 2018 contract closed at $4.74 3/4, unchanged for the week. The secondary (intermediate-term) trend looks to have turned up last week. Though the weekly close was unchanged, the strong rally off the new contract low of $4.63 1/4 looks to be a bullish spike reversal. This move led to the establishment of a bullish crossover by weekly stochastics below the oversold level of 20%. If the secondary trend has turned up, initial resistance is pegged at near $5.01. This price marks the 23.6% retracement level of the previous downtrend from $6.23 through last week's low.
HRS Wheat (Cash): The DTN HRS Wheat Index (SW.X, national average cash price) closed at $5.94, up 12 1/2 cents for the week. The SW.X remains in a secondary (intermediate-term) uptrend on its weekly close-only chart. Friday's settlement was a new 4-week high, with initial resistance pegged at $6.08 3/4, a price that marks the 23.6% retracement level of the previous downtrend from $7.30 1/4 through the low weekly close of $3.71 1/4.
HRS Wheat (New-Crop Futures): The Minneapolis September 2018 contract closed at $6.41, up 8 cents for the week. New-crop Minneapolis spring wheat is in a secondary (intermediate-term) sideways trend with support at the 4-week low of $6.28 1/2 and initial resistance the recent high of $6.49.
To track my thoughts on the marketthroughout the day, follow me on Twitter:www.twitter.com\Darin Newsom
Comments
To comment, please Log In or Join our Community .