

Technically Speaking
Weekly Analysis: Grain Markets

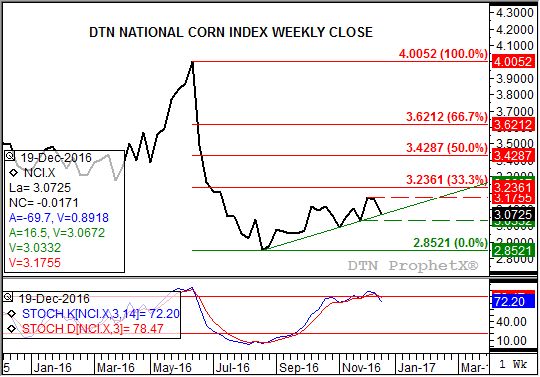
Corn (Cash): The DTN National Corn Index (NCI.X, national average cash price) closed at $3.07 1/4, down 8 3/4 cents for the week. The secondary (intermediate-term) trend has turned sideways with resistance at the 4-week high (weekly close) of $3.17 1/2 and support the 4-week low (weekly close again) of $3.03 1/4. Weekly stochastics did see a bearish crossover last week, but below the overbought level of 80%. This leaves open the possibility of an exhaustion rally to test next resistance near $3.23 1/2 before the secondary trend turns down.
Corn (Old-crop Futures): The March contract closed 10.50cts lower at $3.45 3/4. The secondary (intermediate-term) trend has turned sideways with resistance still pegged near $3.67 3/4. This price marks the 33% retracement level of the previous secondary downtrend from $4.53 1/4 through the low of $3.25. Initial support is at $3.47, then near $3.39 3/4.
Corn (New-crop Futures): The December 2017 contract closed 10.25cts lower at $3.76 1/4. The secondary (intermediate-term) trend has turned sideways with initial resistance now at the 4-week high of $3.93. Initial support is near $3.77, then $3.70 3/4.
Soybeans (Cash): The DTN National Soybean Index (NSI.X, national average cash price) closed at $9.21 3/4, down 45 3/4 cents for the week. Despite coming up short of finishing off its secondary (intermediate-term) uptrend, the NSI.X now looks to be in its seasonal downtrend that tends to last through early February. Support is pegged between $9.12 3/4 and $9.02 1/2, prices that mark the 67% and 76.4% retracement levels respectively of the previous rally from $8.77 3/4 (week of October 10) through the high of $9.83 (week of November 28).
P[L1] D[0x0] M[300x250] OOP[F] ADUNIT[] T[]
Soybeans (Old-crop Futures): The March contract closed at $9.97 1/2, down 49 1/4 cents for the week. Though not technically finishing its previous secondary (intermediate-term) uptrend with a bearish crossover by weekly stochastics above the oversold level of 80%, the trend now looks to be down. March soybeans posted a new 4-week low $9.97, with next support pegged between $9.92 3/4 and $9.81. These prices mark the 67% and 76.4% retracement levels respectively of the previous rally from $9.38 through the high of $10.74.
Soybeans (New-crop Futures): The November 2017 contract closed at $9.81 1/4, down 38 1/2 cents for the week. As mentioned in this space last week, weekly stochastics established a bearish crossover above the overbought level of 80% setting the stage for a secondary (intermediate-term) downtrend. Nov beans then fell hard last week, establishing a new 4-week low of $9.80 3/4. Next support is at $9.72 then $9.50, prices that mark the 38.2% and 50% retracement levels of the previous 5-Wave uptrend from $8.57 (week of August 24, 2015) through the high of $10.43 (week of November 28).
SRW Wheat (Cash): The DTN National SRW Wheat Index (SR.X, national average cash price) closed at $3.45 3/4, down 15 cents for the week. The cash SRW wheat market continues to grind lower with the SR.X within pennies of its previous set of low weekly closes of $3.45 and $3.44. Weekly stochastics are bearish again meaning new lows could be seen in the coming weeks.
SRW Wheat (New-crop Futures): The Chicago July 2017 contract closed at $4.20 3/4, down 14 cents for the week. The contract extended its secondary (intermediate-term) downtrend last week as it posted a new low of $4.20.
HRW Wheat (Cash): The DTN National HRW Wheat Index (HW.X, national average cash price) closed at $3.00, down 11 3/4 cents for the week. Cash HRW saw its secondary (intermediate-term) trend turn sideways last week, but could quickly become a downtrend with a move below its 4-week low (weekly close) of $3.00. If that occurs next support is at the previous low weekly close of $2.89 3/4 (week of October 3).
HRW Wheat (New-crop Futures): The Kansas City July 2017 contract closed at $4.29, down 9 1/2 cents for the week. The contract has resumed its downward path with support at its low of $4.23 1/2.
HRS Wheat (Cash): The DTN HRS Wheat Index (SW.X, national average cash price) closed at $4.87 1/2, down 17 1/4 cents for the week. The secondary (intermediate-term) trend turned down last week as the lower weekly close led to the establishment of a bearish crossover by weekly stochastics above the overbought level of 80%. Initial support (weekly close only) is between $4.81 3/4 and $4.78 1/4, prices that mark the 33% and 38.2% retracement levels of the previous uptrend from $4.35 (week of August 29) through the high near $5.05 (week of December 12).
HRS Wheat (New-crop Futures): The Minneapolis September 2017 contract closed at $5.38 1/4, down 10 cents for the week. The secondary (intermediate-term) trend has turned sideways with resistance at the 4-week high of $5.53 3/4 and support the previous low of $5.36 1/2. If this support doesn't hold the contract could fall back to its low of $5.20.
To track my thoughts on the markets throughout the day, follow me on Twitter:www.twitter.com\Darin Newsom
Comments
To comment, please Log In or Join our Community .